S&P 500 Equal Weight Index
The S&P 500 is dominated by the "magnificent seven" which creates significant concentration risk. The S&P 500 equal weight index offers a possible alternative.
The S&P 500 is the most common benchmark for large capitalization stocks in the United States. As its name implies, the index is comprised of 500 companies and covers approximately 80% of the total capitalization of the stock market.
A wide variety of mutual funds and exchange traded funds (ETFs) track the S&P 500 which makes it possible for investors to participate in the stock market at extremely low cost. For example, Vanguard’s S&P 500 ETF has an expense ratio of a microscopic three basis points, or 0.03%. Investing $1 million in the fund incurs an annual cost of only $300. In comparison, a typical 1% expense ratio for an actively managed fund would result in costs of $10,000 per $1 million invested. The cost advantage is one major reason for the rise of passive investing in recent decades.
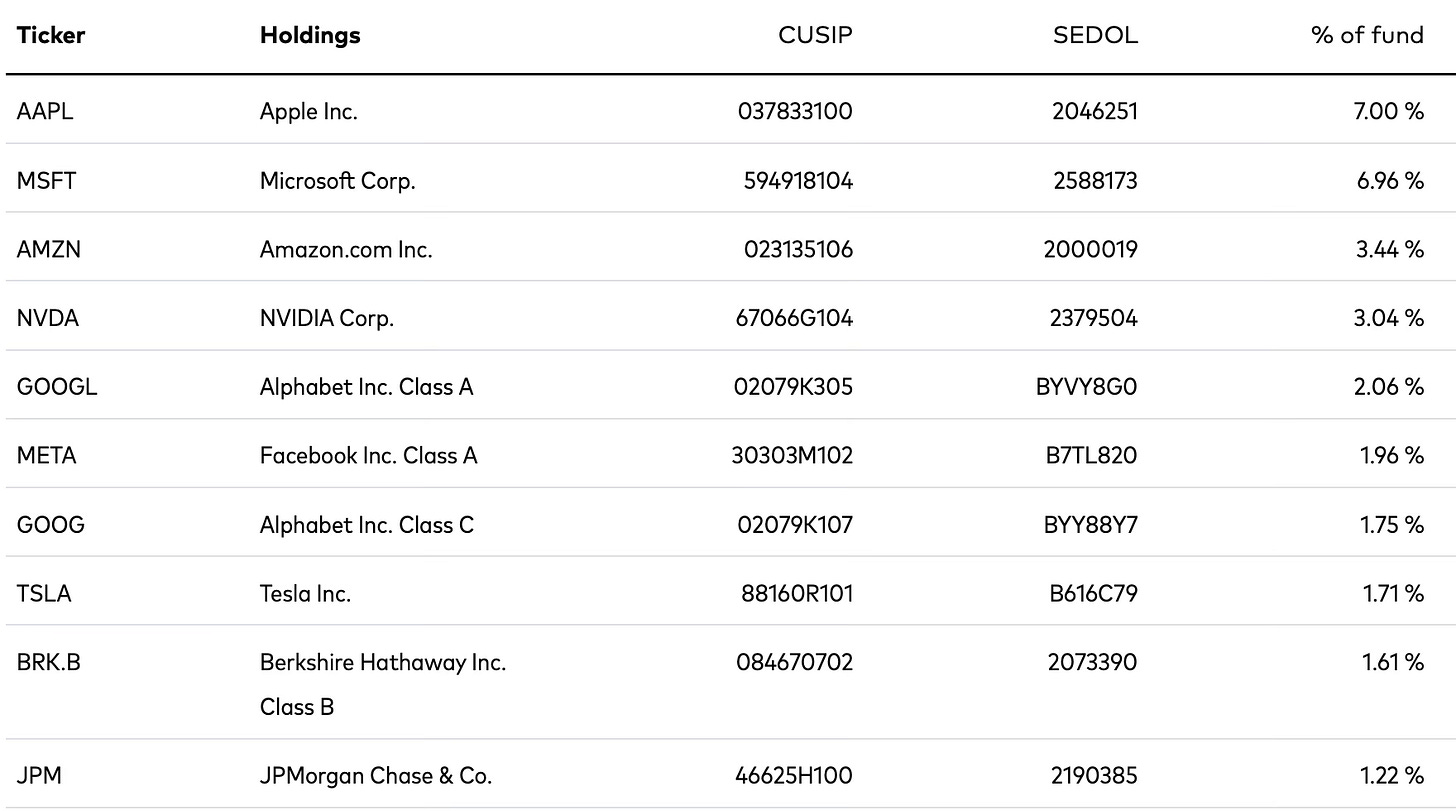
As a market capitalization weighted index, the S&P 500 is highly concentrated in the very largest companies included in the index. For better or worse, investors who own the index will be disproportionately exposed to these mega cap stocks. Lately, the highest profile mega-cap stocks have been referred to as the “Magnificent Seven” which are comprised of Microsoft, Apple, Nvidia, Amazon, Meta Platforms, Alphabet, and Tesla. These seven stocks account for ~28% of the S&P 500. The exhibit below shows the top ten components of the Vanguard S&P 500 ETF as of December 31, 2023:

Is there anything wrong with being highly concentrated in the “Magnificent Seven” stocks? Not necessarily. In recent years, investors have been richly rewarded for owning these companies both directly and through index funds as they have come to dominate the stock market. It has been exceptionally difficult for investors who are not exposed to these companies to keep up with the S&P 500.
Investors who opt for a strategy that indexes to the S&P 500 should keep in mind that returns in the future are likely to be lower than returns over the past decade. I made the case that investors should reduce their expectations last month in Mr. Buffett on the Stock Market where I drew parallels between the conditions Warren Buffett wrote about in a Fortune article published in November 1999 and the current environment.
In December, I wrote about passive investing strategies and mentioned that I would investigate the topic this year. This is a vast subject. Investors are not at all limited to the S&P 500. One can track the total U.S. stock market, industry sectors, foreign markets, and many more esoteric indices. Many index fund investors have not adopted a fully passive approach. Instead, they are making bets on sectors or countries, hoping to outperform simple benchmarks like the S&P 500. In a sense, investors can use index fund products to actively manage their portfolio rather than be truly passive.
Those of us who recall the late 1990s will never forget the stock market bubble and subsequent crash. Warren Buffett’s article was published in the waning days of the bubble. While history never repeats exactly, it is hard to ignore the exuberance over artificial intelligence today and not compare it to the technology mania of the late 1990s. AI is likely to change the world just as the internet did, but there are limits to how high tech stocks can be bid up without compressing future returns.
What if an investor is concerned about the dominance of tech stocks in the S&P 500? If you invest $100,000 in the S&P 500, ~$28,000 will be invested in the “Magnificent Seven”. At least that is the case if you invest in a fund that tracks the S&P 500 on a market capitalization weighted basis.
There is another potential option: The S&P 500 Equal Weight Index. This index allocates approximately 0.2% to each of the five hundred companies in the S&P 500 regardless of the size of the company. The largest and smallest company included in the index are both treated equally. As a result, the “Magnificent Seven” accounts for just 1.4% of the S&P 500 Equal Weight Index. Concentration risk is eliminated, but the upside of continued outperformance of the “Magnificent Seven” is also eliminated.
Let’s take a look at the S&P 500 Equal Weight Index in terms of construction, industry concentration, and historical performance to better understand the risks and potential rewards of investing in this alternative to the standard S&P 500.
Construction
The S&P 500 Equal Weight Index is designed to be a “size-neutral” version of the S&P 500. Every quarter, the index is rebalanced to allocate 0.2% of its weight to each of the five hundred components of the S&P 500. Between quarterly rebalancing, allocations to each component will vary based on performance of the underlying securities.
The rules governing index inclusion and the discretion used by the committee can result in large companies being omitted from the S&P 500. For example, prior to being added to the S&P 500 in 2010, Berkshire Hathaway was the largest U.S. company omitted from the index. This was reportedly because of illiquidity due to the high stock price. When Berkshire’s Class B shares were split 50:1 in connection with the BNSF acquisition, Berkshire was finally added to the S&P 500.
“The selection process for the S&P 500 is governed by quantitative criteria—including financial viability, public float, adequate liquidity, and company type—that determine whether a security is eligible for inclusion. The committee’s role is to choose among those eligible stocks, taking sector representation into account. Among the key requirements are that a company has a sizeable enough market capitalization to qualify as a large-cap stock. It also must have sufficient float, or percentage of shares available for public trading.”
The components of the S&P 500 are reviewed frequently for continued eligibility. Companies that are deleted from the index due to delisting or bankruptcy are replaced with eligible companies at the discretion of the committee. So, in a sense, the S&P 500 is not a formulaic passive index but a “portfolio” overseen by S&P Global.
The S&P 500 Equal Weight Index was launched on January 8, 2003. According to the index factsheet, there is only one ETF traded on a U.S. exchange that tracks the index: The Invesco S&P 500 Equal Weight Index (Ticker: RSP). The fund began trading on April 24, 2003, shortly after S&P introduced the index, and has an expense ratio of 0.2%, significantly higher than ETFs that track the market cap weighted S&P 500.
Industry Concentration
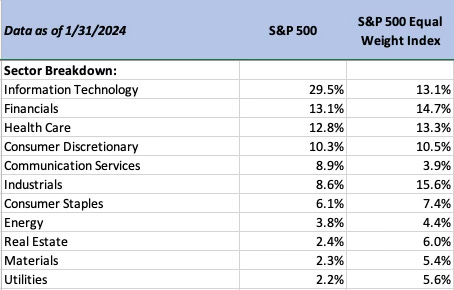
Given the dominance of the “Magnificent Seven” in the market cap weighted S&P 500, it should come as no surprise that information technology and communication services make up a large percentage of the index. Microsoft, Apple, and Nvidia are in the information technology sector. Meta and Alphabet are communication services. Tesla and Amazon are classified as consumer discretionary. The exhibit below shows the industry allocations for the market cap weighted and equal weight S&P 500:
The market cap weighted S&P 500 has a 38.4% combined allocation to information technology and communication services while the equal weight S&P 500 has a 17% combined allocation. The equal weight index has more exposure to utilities, materials, real estate, energy, consumer staples, and has far more exposure to industrials.
Whether one considers the composition of the equal weight index to be superior depends principally on an assessment of the attractiveness of the “Magnificent Seven.” Reducing exposure to these seven companies from ~28% to ~1.4% is clearly going to have a massive impact on sector concentration. In recent years, investors who have avoided these sectors have paid a heavy price.
Performance
The following exhibit compares the total returns of the market cap and equal weight S&P 500 over the past decade. The first section shows annualized returns for the 1, 3, 5, and 10 years ending on January 31, 2024. The second section shows calendar year returns from 2014 to 2023.
We can see that annualized returns for the market cap weighted index have exceeded the equal weight index by significant margins, particularly for the one year ending on January 31, 2024. Of course, this was a period of exceptionally strong performance for technology stocks and the market cap weighted index had far more representation in that sector. Over a full decade, the market cap weighted index outperformed the equal weight index by nearly 2%. The margin would be even greater in the real world since Invesco’s ETF tracking the equal weight index has a much higher expense ratio than ETFs tracking the market cap weighted index.
Calendar year returns are much less useful than longer term annualized returns. We can see that the market cap weighted index outperformed in six of the ten years. The largest outperformance of the market cap weighted index was in 2023 while the largest outperformance of the equal weighted index was in 2022.
A decade is a long period of time by anyone’s definition, but it can still be useful to take a longer view. Last year, Invesco published an article shortly after the twentieth anniversary of the launch of their S&P 500 equal weight ETF. From inception through the end of September 2023, RSP outperformed the market cap weighted S&P 500 by a meaningful amount, as shown in the exhibit below taken from the article:

The chart shows the total return of RSP compared to the total return of the S&P 500 index and includes the 0.2% expense ratio charged by RSP compared to no expense ratio for the index. The outperformance amounts to 0.57% on an annualized basis since RSP’s inception. This is a relatively modest outperformance but still meaningful.
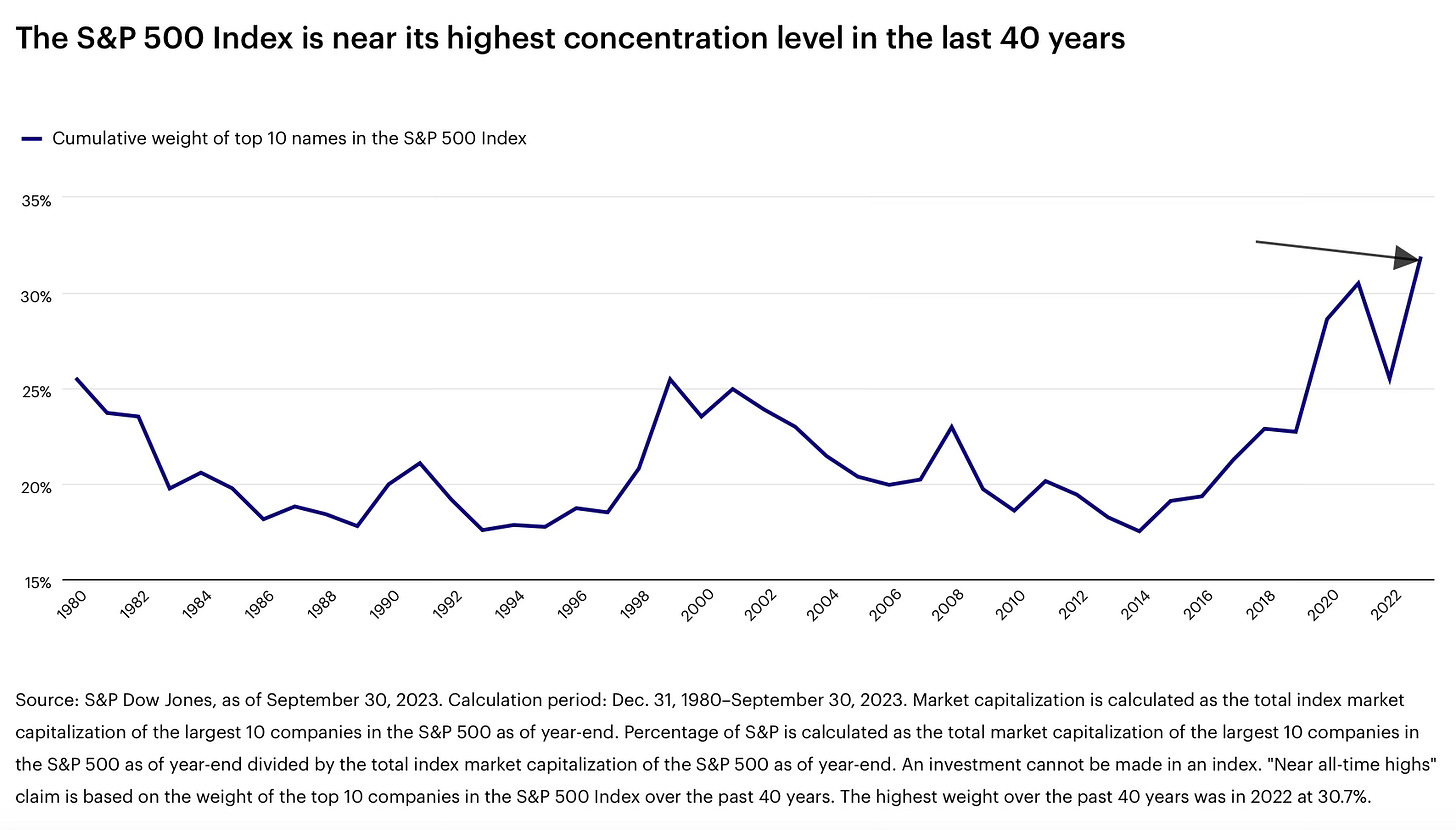
Of course, the article is a sales document and Invesco attempts to interest investors by pointing out the high concentration in the market cap weighted S&P 500 which they claim to be near a 40 year high, as seen in the following exhibit from the article:

The bottom line is that the equal weight S&P 500 has underperformed over the past decade, but if we take a longer view, it has provided modest outperformance while being far less concentrated.
Problems with Equal Weighting
Stock prices obviously move around dramatically in the short run and an equal weight index is obliged to rebalance frequently to keep each position at approximately the same size. In the case of the S&P 500 Equal Weight Index, the rebalancing occurs on a quarterly basis. In practice, this means that a fund, such as RSP, that tracks this index is obligated to sell the stocks that performed better than average during the quarter and to buy the stocks that performed worse than average.
This sounds like a contrarian approach but it can also amount to “watering the weeds and cutting the flowers.” Markets often do crazy things in the short run, but we cannot ignore the fact that stocks often rise and fall for fundamental reasons. Many stocks that rise dramatically deserve to rise and of course there is a very large graveyard of stocks that not only deserve to drop but ultimately become worthless.
We face an interesting philosophical question. Adopting a passive approach to investing requires some confidence that markets are “efficient”, at least in the very long run. We can debate the current valuation of the “Magnificent Seven”, but the fact is that there is a reason that Apple and Microsoft have risen to compete for the number one spot with market valuations of ~$3 trillion each. During the entire rise of these great businesses, a fund such as RSP would constantly be trimming the position size to keep it at 0.2% of the total fund. Meanwhile, the market capitalization weighted index would let the position ride up to a higher allocation. One could argue that great companies deserve a higher allocation than mediocre and poor companies.
The rebalancing required by an equal weight index means that costs will be higher for a fund such as RSP. Although Invesco has not paid a capital gains distribution since inception of the fund over two decades ago, the potential for adverse consequences in a taxable account exists in an ETF that trades more frequently. The expense ratio of RSP, while far lower than most actively managed funds, will remain stubbornly higher than the expense ratio for an ETF tracking the market cap weighted S&P 500.
Conclusion
While the idea of an equal weighted S&P 500 seems attractive at first glance, I am not sure that it is the best way to avoid a high degree of concentration in technology stocks or even if it makes sense to try to avoid this concentration for those who are adopting a truly passive approach to equity investing.
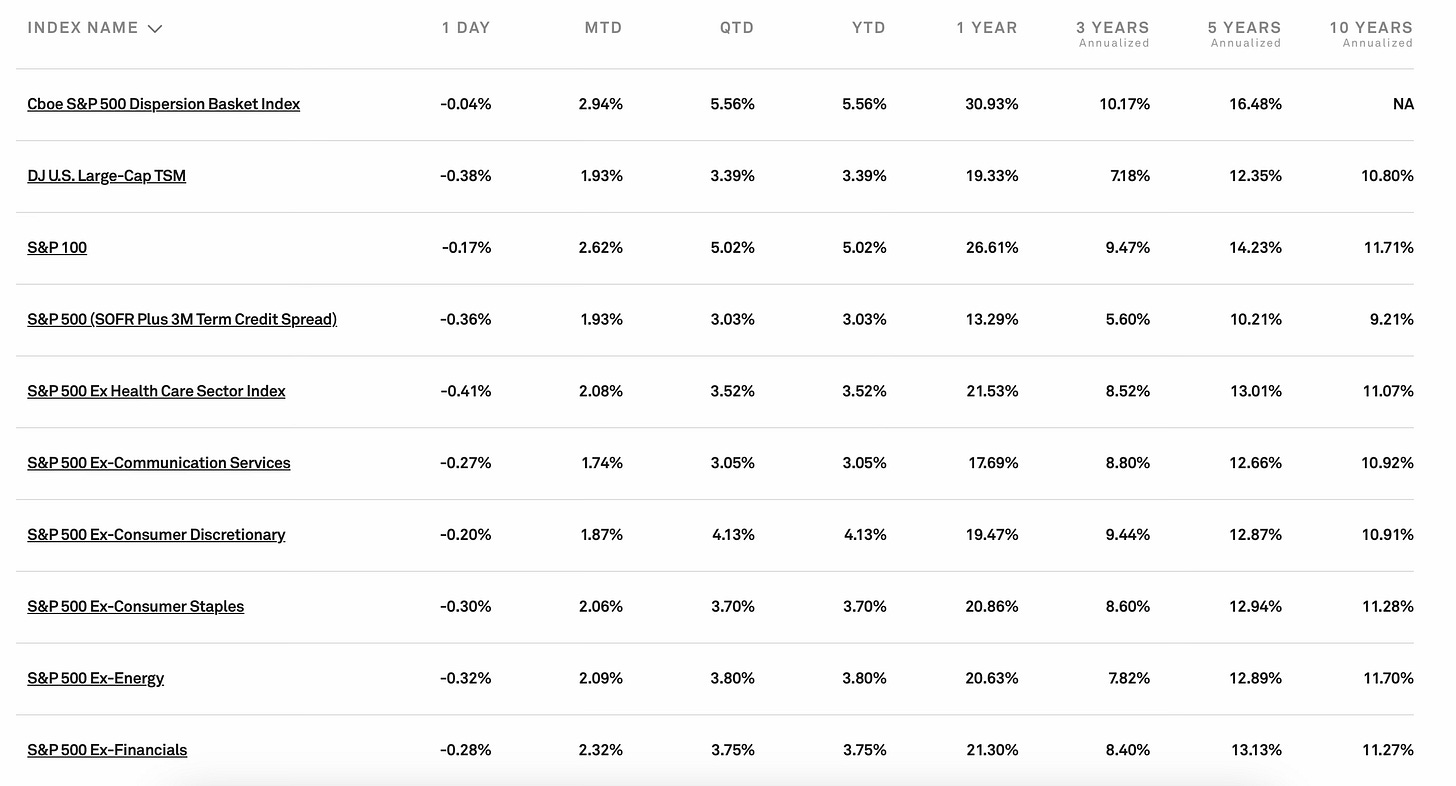
S&P Global maintains an array of indices which allow investors to avoid various sectors. There is even a S&P 500 index that excludes information technology that one can track using a ProShares ETF (Ticker: SPXT) with an expense ratio of 0.09%. The exhibit below shows only a partial subset of the dizzying selection of indices that S&P Global maintains, most of which have at least one ETF tracking to the index:
It is possible to eliminate exposure to an industry sector while maintaining market cap weighted exposure to other stocks within the S&P 500. So, if the goal is to minimize technology or communication services exposure, the investor might be best served by investigating one of these alternate ETFs rather than opting for RSP.
Of course, index funds can be used to obtain exposure to foreign stock markets as well as fixed income markets. An investor who is concerned about excessive exposure to the “Magnificent Seven” might look into adding foreign stocks or increasing allocations to treasury bills, TIPS, or other fixed income securities.
The real question ultimately boils down to whether one wishes to be active or passive. Passive investment means accepting occasional periods of exuberance in various stocks and industry sectors. Active investing, whether in individual stocks or in sectors, is an assertion of a point of view that may be correct or incorrect. If the overall stock market is likely to produce less generous returns over the next decade than in the recent past, the passive solution is to accept this and plan accordingly. I am skeptical that equal weighted funds make much sense in this context.
If you found this article interesting, please click on the ❤️️ button and consider sharing this issue with your friends and colleagues.
Thanks for reading!
Copyright, Disclosures, and Privacy Information
Nothing in this article constitutes investment advice and all content is subject to the copyright and disclaimer policy of The Rational Walk LLC.
Your privacy is taken very seriously. No email addresses or any other subscriber information is ever sold or provided to third parties. If you choose to unsubscribe at any time, you will no longer receive any further communications of any kind.
The Rational Walk is a participant in the Amazon Services LLC Associates Program, an affiliate advertising program designed to provide a means for sites to earn advertising fees by advertising and linking to Amazon.com.


Some would disagree that SPY vs RSP comes down to active vs. passive. SPY is active they say (and I agree).
If we expand our thinking, the choice array is much broader than cap wt companies vs. equal wt. companies. Chris Schindler points out in a recent Resolve Riffs podcast that even though equal wt offers some advantages relative to cap wt, it also has disadvantages (https://investresolve.com/single/resolve-riffs/ beginning about 10 min. mark).
Perhaps the biggest challenge is choosing the units to equal weight Companies are problematic, e.g. consider whether Alphabet is one or many companies (what if govt forces a breakup-what was weighted as 1 company is now multiple). Perhaps better approach is using other units, e.g. fundamental metrics/units as pioneered by Research Affiliates RAFI. Weighting based on a dollar of earnings is simple and efficient, avoids some of the definitional problems of "unit." And, has the benefit of outperforming. (See RA website for definition on various fundamental units, implementation and performance research.)