Introduction
The United States has experienced a rapid acceleration of consumer price inflation since early 2021 despite initial assurances from the Federal Reserve and politicians that price increases would be “transitory”. Official annualized inflation, as measured by the Consumer Price Index for all Urban Consumers (CPI-U) increased from 1.4% in December 2020 to 5.4% in June 2021. Far from being “transitory”, the CPI-U then soared to 7% in December 2021 and 9.1% in June 2022.
Of course, individual components of the CPI-U tend to move around much more than the overall measure. This has been most evident for components that are directly influenced by commodity prices with energy costs being the most obvious example. However, volatility has not been restricted to commodities. The price of new and used vehicles have both increased at a rapid clip over the past year.
The chart below shows the trailing twelve month rate of inflation for the CPI-U along with new and used vehicles:

My first car was a 1965 Ford Mustang that was nearly a quarter-century old by the time I was lucky enough to own it. One obvious thing about the car was its complete lack of modern technology. I could perform basic maintenance, such as oil changes, replacing spark plugs, rebuilding the carburetor, and much more without resorting to the use of any technology more advanced than a repair manual printed on paper.
Nostalgia has its place, but you cannot stop progress. The world has changed, and modern vehicles are essentially rolling computer systems heavily laden with advanced technology. Highly trained technicians are needed to perform most maintenance procedures. Supply chains for automobiles have become increasingly intricate and fragile and “just-in-time” inventory systems leave little margin for error. Assembly lines can be brought to a halt when key components suddenly become unavailable.
At the start of the pandemic, automakers closed plants in order to comply with mandates to shut down production in order to protect employees. Potential customers were unable to visit dealerships and the industry braced for a downturn of indeterminate length. The actions taken by automakers at the start of the pandemic rippled down the supply chain and caused companies supplying key components to also curtail or redirect production. These actions, while necessary at the time, turned out to not be easily reversible when the economy started to gradually open up.
Modern automobiles use hundreds of microchips. When auto production came to a halt in early 2020 and only slowly ramped back up, the industry reduced orders for microchips. However, customer demand for electronics continued through the pandemic and by the time automakers were ready to ramp up production, microchips were in short supply. Although conditions in microchip supplies have been easing recently, this has not entirely alleviated production problems for automakers.
When consumer demand increases and supplies are tight, the predictable result is a rise in prices, and this is exactly what has happened for new cars. The average price paid for a new vehicle exceeded $48,000 in June 2022 for the first time. As a point of comparison, two years ago, the average price of a new vehicle was $38,530. To make matters worse, interest rates for auto loans have been rising. The average monthly payment on a new car loan was $686 in June 2022 and 12.7% of new car buyers have signed up for monthly payments over $1,000.
With new cars in short supply, used cars began to experience rapid inflation starting in September 2020. This inflation was more extreme than for new cars. In June, I published a profile of America’s Car-Mart which included the following chart showing the average sales price of Car-Mart vehicles over time:
America’s Car-Mart offers vehicles at the low end of the used market. Most vehicles are between five and twelve years old and have between 70,000 to 150,000 miles.
CarMax is a the largest used-car dealership in the United States and offers vehicles that are generally newer and have lower mileage compared to America’s Car-Mart. The following graph shows the average sales price of CarMax vehicles over time:
The rapid rise in used car prices has resulted in strange situations such as cars actually appreciating in value. In some cases, people who purchased vehicles several years ago have been able to sell at a profit, something that is normally unheard of. Recovery rates realized by dealers who must repossess vehicles have also increased, leading to more aggressive repossessions. In normal times, dealers avoid repossession since it usually results in significant losses.
It is interesting to research sectors of the economy in turmoil and the automobile industry is no exception. In addition to the profile of America’s Car-Mart published in June, I have been researching CarMax more recently for a profile that will be published next week. Rather than include background information on the automobile industry in the CarMax write-up, I decided to put together this article to bring together some of the trends and sources that I’ve found.
The information in this article might be useful to those who are interested in further study of the auto industry. I have simply included a number of statistics that I find interesting. There is no overall theme to this article other than to highlight selected statistics and trends along with data source links for further study. I have created many of the charts based on underlying data sets while other charts are used directly. The exhibit captions contain links to the underlying source.
Interesting Statistics and Trends
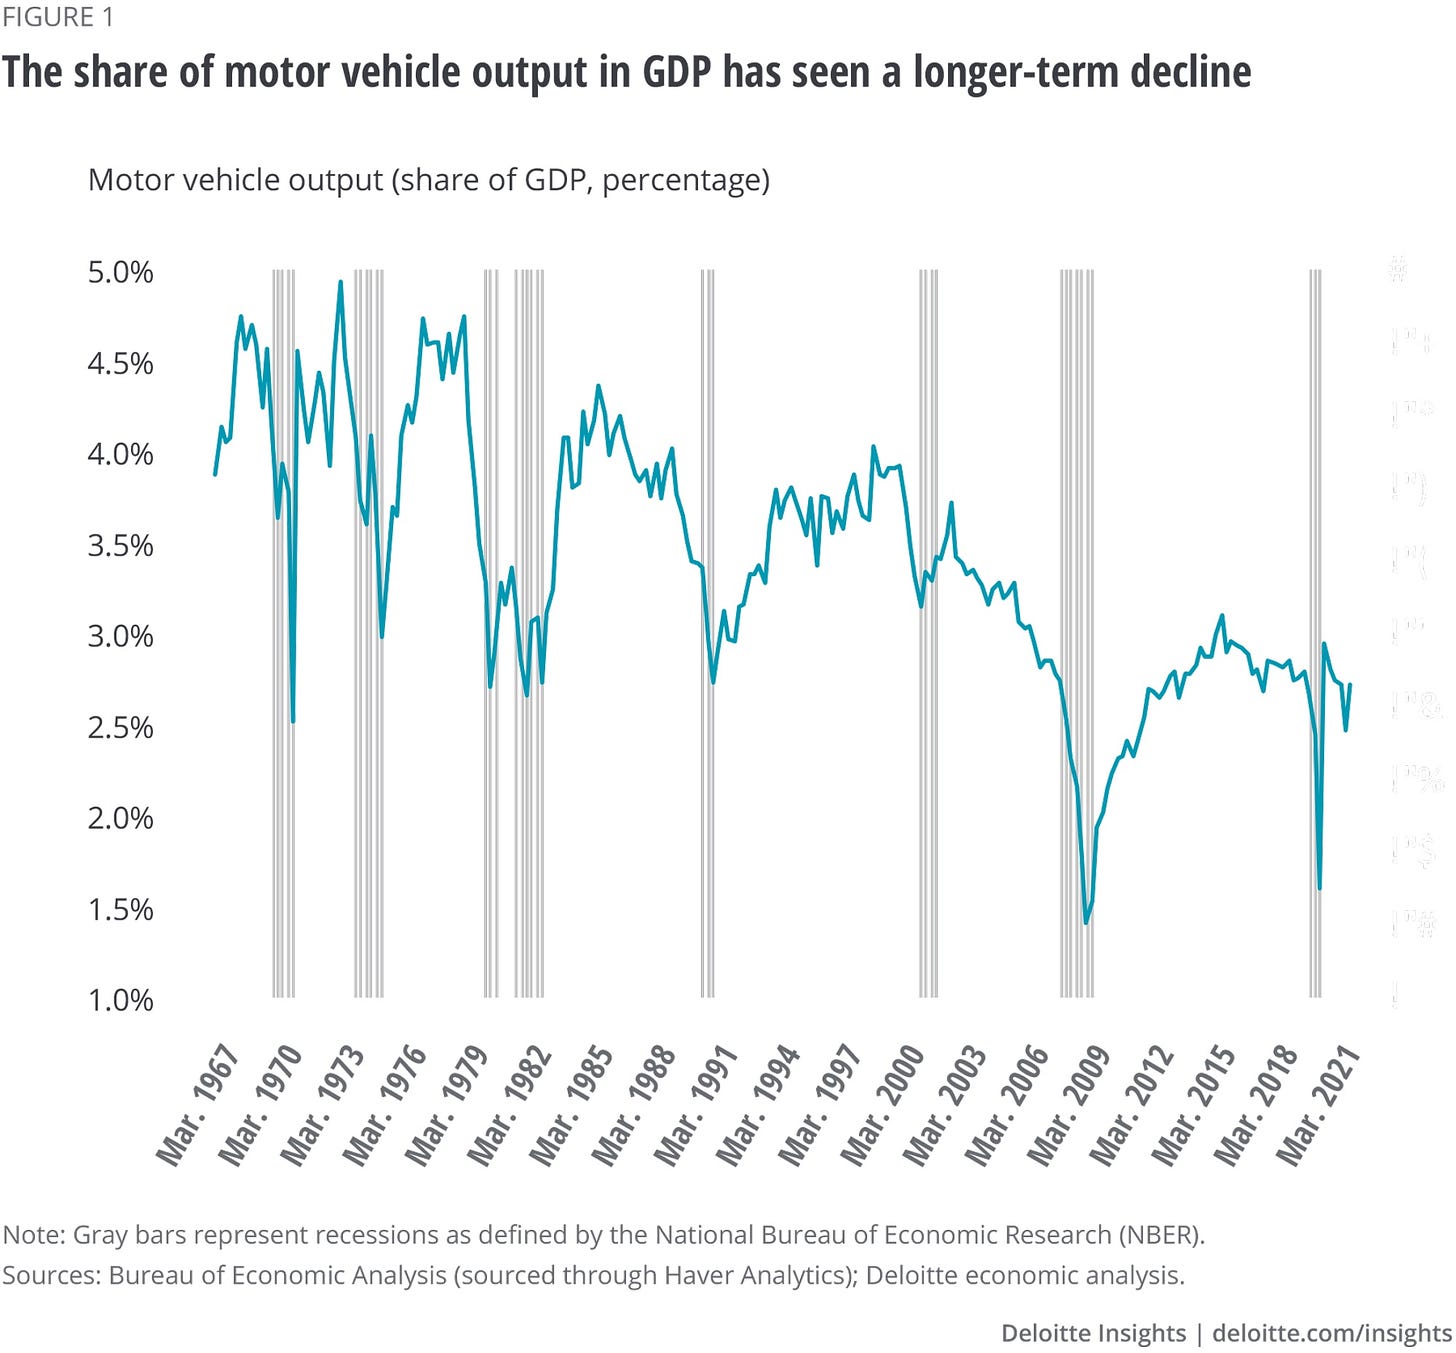
The automobile market is an important component of gross domestic product. GDP figures include the value of new motor vehicles and parts. The used market is not included in GDP figures. In the second quarter of 2020, new motor vehicles and parts were running at $734.2 billion on a seasonally adjusted annualized basis. This was slightly under 3% of GDP for the second quarter. The following chart shows the share of motor vehicle output as a percentage of GDP over several decades:

According to a recent Deloitte report, the downward trend in the importance of domestic automobile production has to do with an increasing share of imports as well as higher growth in other sectors of the economy. We can see from the chart that automobile production is also highly cyclical, as we would expect. The sharp decline and subsequent rebound experienced during the pandemic was exaggerated and compressed, but not atypical compared to prior economic downturns.
The exhibit below shows the total number of motor vehicles registered in the United States since 1990. As of 2020, there were just under 276 million registered vehicles, of which 253.1 million were light duty vehicles and 8.3 million were motorcycles. The balance was comprised of heavy duty trucks and buses. We can see that total number of registered vehicles has increased slowly over the past decade.
It is important to understand that government statistics consider many ordinary passenger vehicles to be light-duty trucks. Along with pickup trucks, most minivans and sport utility vehicles are considered to be light-duty trucks, not automobiles. The automobile category is comprised of what we would identify as cars — sedans, coupes, and convertibles. There has been a multi-decade shift in consumer preferences from automobiles to light-duty trucks. The exhibit below shows the composition of registered vehicles in the United States in 2020.

How much are Americans using their vehicles? As we might expect, total vehicle miles traveled does not normally change that much from year to year. However, the pandemic caused a major reduction in travel which was reflected in a historic plunge in vehicle miles traveled in early 2020:

This plunge was quickly reversed as the economy reopened and we are now essentially back to normal in terms of vehicle usage. As an aside, public transit ridership never recovered from the pandemic. Public transit ridership in May 2022 was down 40.8% from its level in May 2019. It appears that people have returned to their cars, but not necessarily for the purpose of commuting, which is the primary use of public transit.
Over time, the durability of automobiles has increased, and this has been reflected in a rising average age of light vehicles in operation, as shown in the exhibit below:
Given the relatively slow growth in registered vehicles and miles traveled, it stands to reason that an increasing age of the light-vehicle fleet would reduce the number of new vehicles required annually. The increasing average age of vehicles also has implications for the used vehicle market. As vehicles last longer, resale value is likely to hold up somewhat better over time. The used car buyer looking at a typical seven year old car today could reasonably expect it to last another five to seven years. Two decades ago, a seven year old car was quickly approaching the end of its expected life.
The exhibit below shows light vehicle sales in the United States since 1976. What is perhaps surprising is the amount of time that was required to recover from the decline during the financial crisis and recession of 2008-09. Aside from a brief spike that I believe was due to the “cash for clunkers” program, it took several years for auto sales to recover to the 15-18 million unit range that prevailed prior to the crisis.

As noted previously, the average age of a light vehicles in the United States has increased significantly, something we can deduce from total registered vehicles rising slowly over time even as new vehicle sales experienced a prolonged downturn during the first half of the 2010s.
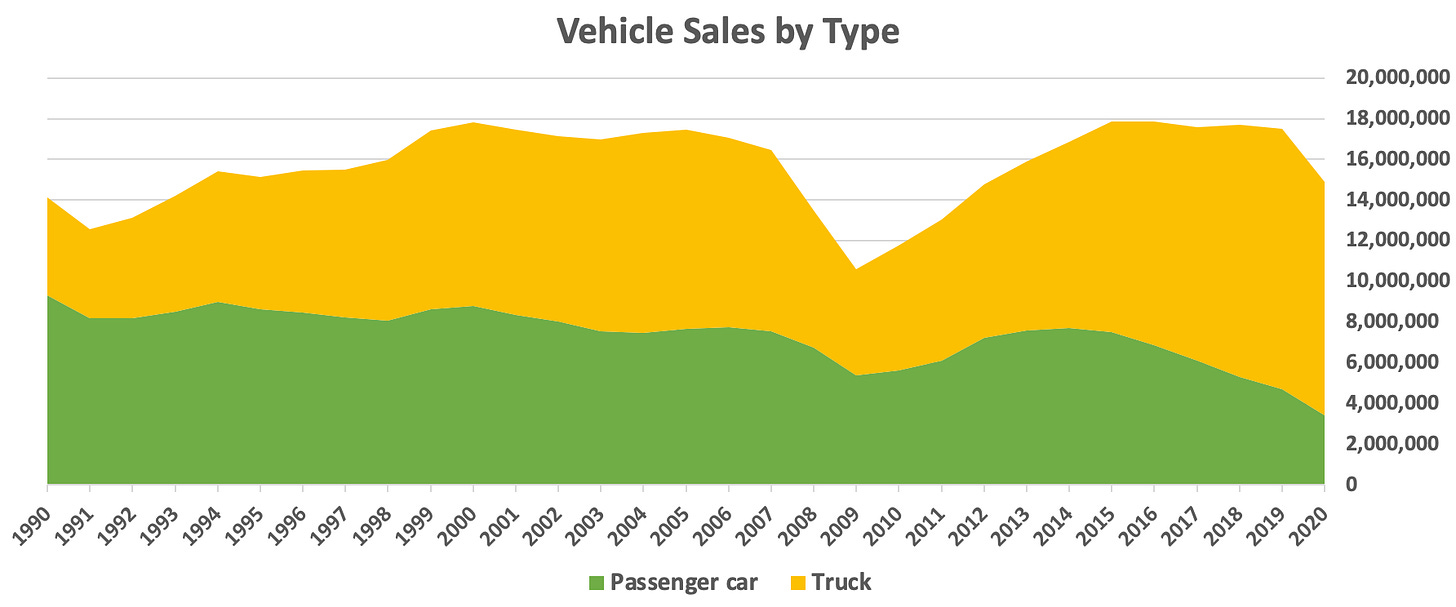
As noted earlier, market preferences have shifted from passenger vehicles to light trucks in recent years. The following chart is similar to the one above except it breaks down total light vehicle sales between passenger vehicles and light trucks.1
Now that we have looked at some of the high level trends in terms of the size of the vehicle fleet and annual sales, let’s take a look at new and used auto prices. There are multiple sources of auto price data, some of which is behind paywalls. However, I have found publicly available pricing data from the Bureau of Transportation Statistics which gives us a sense of how new and used auto prices have trended in nominal dollars over long periods of time.
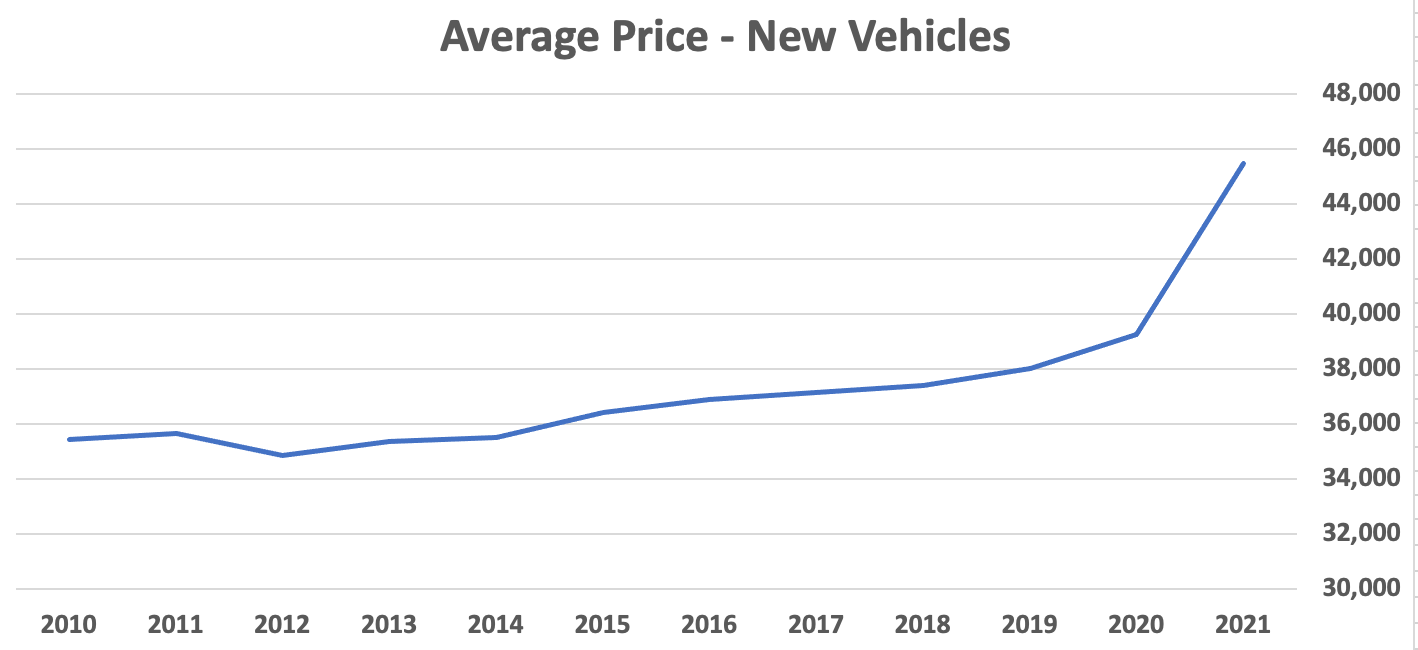
The following chart shows the average price of a new vehicle from 2010 to 2021. While the underlying data set includes figures prior to 2010, they are not directly comparable to more recent data due to a change in the data source.
The Bureau of Transportation Statistics dataset does not include used car prices after 2019, so it is of limited utility for our purposes. However, we do have the charts for America’s Car-Mart and CarMax presented earlier showing recent trends in used car prices at the low-end and mainstream segments of the used car market.
In nominal terms, both new and used car prices have increased significantly over the years. However, according to the Bureau of Labor Statistics, quality improvements in automobiles supposedly accounted for the entirety of the price increases until the recent post-pandemic spike. The following charts show a very long view of the CPI for new and used vehicles since the mid 1950s.
New Vehicles

Used Vehicles

If you are skeptical that quality improvements account for nearly all of the nominal increases in new and used vehicles from the mid-1990s until just prior to the pandemic, you are not alone. However, it is true that vehicles have improved a great deal over that quarter-century span. The increasing average age of vehicles on the road demonstrates that durability has increased, and it is true that current cars have more electronics and safety enhancements compared to the vehicles of the mid-1990s.
The Bureau of Labor Statistics has published a webpage explaining how it adjusts the CPI for vehicle improvements. Another document, Guidelines for Quality Adjustment of New Vehicle Prices, goes into even more detail. Ultimately, how to account for quality improvements is a judgment call.
In addition to the 1965 Ford Mustang, over the years I have owned a 1987 Plymouth, a 2001 Ford F350, a 2003 Toyota Camry, and a 2008 Ford Mustang. While the 1965 Mustang and 1987 Plymouth were very primitive by modern standards, the vehicles of the 2000s had many of the same conveniences we take for granted today, with the exception of navigation systems and integration with mobile devices.
While the extent of quality adjustments over the past quarter century is debatable, it is clear that we have seen significant inflation since the pandemic that cannot be explained by changes in quality, and the official CPI figures reflect this reality.
Conclusion
It is difficult to study individual companies within an industry without first looking at the industry as a whole. This is definitely the case when it comes to the automobile industry in the United States. We are fortunate to have a wealth of statistics that are publicly available, although it takes quite a bit of digging to uncover the desired data.
Over the past two years, the pandemic has heavily impacted the market for both new and used vehicles. As the supply of new vehicles was constrained due to persistent supply chain problems, buyers turned to the used car market. Heavy demand for used cars caused significant price inflation that far exceeded inflation for new vehicles. As supply chain conditions ease, new vehicle production should increase in the coming months. The impact on new and used car pricing remains to be seen.
Hopefully this article has been helpful to those with an interest in the automobile market. Next week, I will publish a profile of CarMax, the largest used car dealership in the United States.
The Rational Walk is a reader-supported publication
To support my work and to receive all articles that I publish, including premium content, please consider a paid subscription. Thanks for reading!
Copyright, Disclosures, and Privacy Information
Nothing in this newsletter constitutes investment advice and all content is subject to the copyright and disclaimer policy of The Rational Walk LLC.
Your privacy is taken very seriously. No email addresses or any other subscriber information is ever sold or provided to third parties. If you choose to unsubscribe at any time, you will no longer receive any further communications of any kind.
The Rational Walk is a participant in the Amazon Services LLC Associates Program, an affiliate advertising program designed to provide a means for sites to earn advertising fees by advertising and linking to Amazon.com.
Note that the Bureau of Transportation Statistics dataset is annual while the St. Louis Fed’s dataset is monthly and shows data on an annualized basis.


