Berkshire Hathaway's Q1 2023 Results
Operating earnings have been on an upward trend as higher interest rates boost investment income and Berkshire's subsidiaries turn in a solid performance.
As shareholders began to file into the arena for Berkshire Hathaway’s 2023 annual meeting, the company’s first quarter results were released. Shareholders in a mad rush to secure seats might have been in a celebratory mood after glancing at their phones to see that Berkshire reported net earnings of $35.5 billion for the quarter, up sharply from $5.6 billion a year earlier. That’s quite an impressive increase for one year!
Berkshire had a good quarter, but the jump in net income overstates the company’s progress. Since 2018, Berkshire’s results have been severely distorted by an accounting change that requires unrealized gains and losses in the company’s equity securities portfolio to be included in net income. Berkshire’s operating income for the first quarter, excluding investment gains, came in at $8.1 billion, up from $7.2 billion a year earlier.
I was able to conduct a quick review of the 10-Q prior to the webcast and wrote some initial impressions in a Twitter thread. A more detailed review had to wait until after the question and answer session when Warren Buffett and Charlie Munger answered questions for over five hours. On Monday, I published an article with my impressions of the questions related to succession planning, voting control, auto insurance, Occidental Petroleum, Berkshire Hathaway Energy, China, and Apple.
Financial media reports of Berkshire’s quarterly results are typically rushed and misleading. It takes time to delve into the details needed to understand the situation. I can sympathize with reporters who must file news stories immediately. Not facing such constraints, my habit has been to spend more time reviewing the results and to write about a subset of Berkshire’s operations each quarter. While it isn’t practical to delve into every corner of this massive conglomerate in this format, we can at least take a look at high level trends in operating earnings and a few other key areas.
Operating Earnings
Investors should be skeptical when executives attempt to turn their attention away from figures based on Generally Accepted Accounting Principles (GAAP). Investors benefit from uniform and well-understood standards in accounting. All too often, executives point to non-GAAP figures to cast results in a more favorable light or to de-emphasize the role of stock-based compensation. However, there are times when GAAP accounting makes little sense on its merits and adjustments must be made.
I’ve written in the past about how accounting changes introduced in 2018 have distorted Berkshire Hathaway’s results, so I will not belabor the point here. While the performance of Berkshire’s large portfolio of equity securities absolutely does have an impact on long term intrinsic value, quarterly fluctuations are usually meaningless. Obviously, if there is some dramatic underlying business reason for a change in the value of a large holding, that must be considered along with Berkshire’s quarterly operating results, but run-of-the-mill fluctuations are rightly ignored over short periods of time.
The following exhibit shows Berkshire Hathaway’s operating earnings on an after-tax basis alongside the company’s reported net earnings since 2018:
Note that the scale of the y-axis on the two charts differ. Operating earnings ranged from a low of $4.4 billion in Q4 2019 to a high of $9.3 billion in Q2 2022 while net earnings have ranged from a loss of $49.8 billion in Q1 2020 to a profit of $39.6 billion in Q4 2021. The heavy black horizontal line representing the x-axis on the net earnings chart represents breakeven results.
While we can see that both measures fluctuate significantly on a quarterly basis, the fluctuations in net earnings are just wild and provide no analytical value whatsoever. The extremes of net income simply coincide with large swings in stock prices. The magnitude of these swings overwhelms any analysis of Berkshire’s operating results.
The following exhibit shows a reconciliation of after-tax operating earnings with reported net income over the past twelve quarters which is useful to observe variability of results within each of Berkshire’s major reporting areas.1
Berkshire’ insurance underwriting exhibits significant volatility on a quarterly basis which is an inherent part of the business model. Other groups, most notably Berkshire Hathaway Energy and the BNSF railroad, have seasonal patterns. For this reason, operating earnings fluctuate significantly from quarter to quarter. Many shareholders are satisfied with monitoring operating earnings on an annual basis.
One of the slides Warren Buffett displayed at the annual meeting showed operating earnings over the past four years. From this slide, we can see that operating earnings have increased over time. As Mr. Buffett pointed out, since Berkshire has retained earnings and reinvested in its businesses, one should expect operating earnings to rise over time and be higher five, ten, or fifteen years from now.
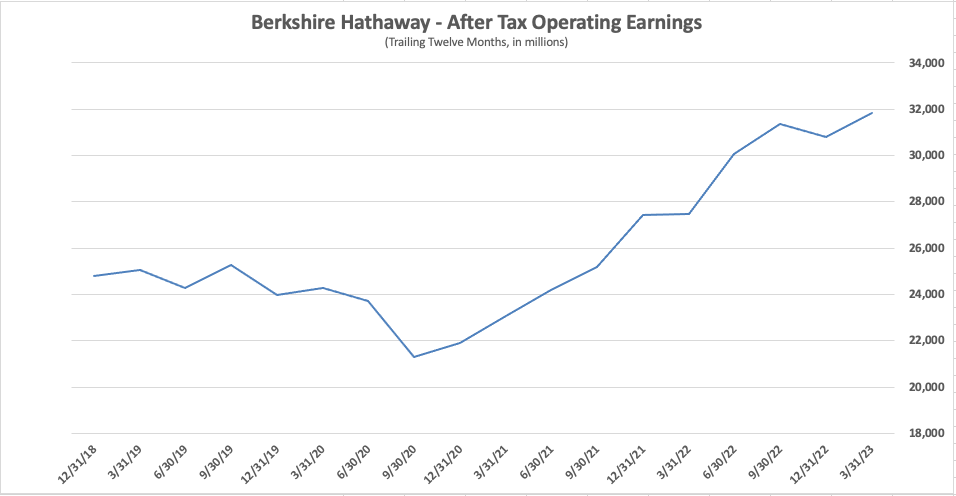
It is useful to track Berkshire’s after-tax operating earnings every quarter on a trailing twelve month basis, as shown in the chart below:
Each point in the graph shows the trailing twelve months, or four quarters, of after-tax operating earnings. For example, the data point for March 31, 2023 is the aggregation of operating earnings for Q2, Q3, and Q4 of 2022 and Q1 2023.
On a trailing twelve month basis, we can see the recovery in operating earnings after the trough of the downturn during the early months of the pandemic. Trailing twelve month operating earnings hit a record high for the first quarter of 2023.
During the Q&A session at the annual meeting, Warren Buffett said that he expects the majority of Berkshire’s businesses will report lower earnings in 2023 compared to last year. However, higher interest rates are sure to benefit Berkshire’s large holdings of short-term treasury bills. As a result, barring major catastrophes, Mr. Buffett expects that operating earnings will increase in 2023.
The rest of this article reviews the following areas in more detail:
GEICO Returns to Profitability
Berkshire divides insurance activities into underwriting and investing because management views these activities as distinct from each other. With few exceptions, managers are directed to underwrite with a goal of profitability which provides Berkshire with cost-free float that can be invested to generate investment income. As of March 31, 2023, insurance float was approximately $165 billion.
Berkshire posted a net underwriting profit of $911 million in the first quarter of 2023 compared to $167 million in the prior year, as we can see in the following table:
The highlight of the quarter was GEICO’s return to underwriting profitability after six straight quarters of underwriting losses. Management increased average premiums per auto policy by 15.2%. However, over the past year, GEICO’s policies-in-force has declined by 2.4 million, or 13%. This dramatic decline in policies-in-force was due to a combination of higher premiums and a significant reduction in advertising spending.
As I discussed last week in Progressive vs. GEICO: The Battle Continues, the entire auto insurance industry has been hammered by inflation over the past two years. GEICO has reduced advertising spending and accepted lower market share while Progressive has aggressively increased advertising spending and picked up customers.
As Ajit Jain noted during Berkshire Hathaway’s 2023 annual meeting, there is a tension between rates and market share. GEICO made a strategic choice to prioritize underwriting profitability over market share in recent quarters. It is worth taking some time to look at GEICO’s recent results in more detail.
The following exhibit shows GEICO’s results over the past twelve quarters:
GEICO’s return to underwriting profitability in the first quarter was aided by favorable reserve development of $338 million. This indicates that management was conservative in reserving for losses in 2022. In contrast, Progressive posted unfavorable reserve development of $621.2 million for the first quarter, indicating that actual losses were worse than expected.
The decline in GEICO’s expense ratio has been remarkable in recent quarters, with the measure coming in at 9.7% of earned premiums for the first quarter. As a point of reference, the expense ratio was 16.1% in the first quarter of 2021. This decline is due to management’s decision to cut advertising spending, and this contributed to the decline in policies-in-force which led to GEICO ceding market share to Progressive.
Berkshire Hathaway’s longstanding underwriting policy is to reject business that management believes will result in underwriting losses. The reduction in advertising spending coupled with higher quoted rates has the effect of repelling business, but this could very well be unprofitable business that management wants to repel. In the long run, GEICO is likely to resume more aggressive advertising spending, but only when management believes the resulting business will produce underwriting profits.
Warren Buffett has been very willing to spend heavily on advertising when he believes profitable business will be the result. Here is a comment Mr. Buffett made in his 1999 letter to shareholders, just a few years after Berkshire acquired GEICO:
“Our strong referral business means that we probably could maintain our policy count by spending as little as $50 million annually on advertising. That's a guess, of course, and we will never know whether it is accurate because Tony's foot is going to stay on the advertising pedal (and my foot will be on his). Nevertheless, I want to emphasize that a major percentage of the $300-$350 million we will spend in 2000 on advertising, as well as large additional costs we will incur for sales counselors, communications and facilities, are optional outlays we choose to make so that we can both achieve significant growth and extend and solidify the promise of the GEICO brand in the minds of Americans.”
Advertising is rightfully viewed as an investment in GEICO’s brand, but this was more relevant in 1999 when market share was far lower and brand awareness was not as widespread. It seems likely that GEICO will continue to curtail advertising for the foreseeable future in exchange for returning to sustained underwriting profitability.
Although GEICO $2.3 billion of cumulative underwriting losses from Q3 2021 to Q4 2022 are significant, we should keep in mind that the long term record is extremely strong. Over the past twenty quarters, GEICO posted cumulative underwriting profits of $6.8 billion. From 2001 to 2022, GEICO posted full-year underwriting profits in all years except for 2017 and 2022. Ajit Jain’s comments during the annual meeting indicate that he expects a small underwriting profit for the full year with a combined ratio slightly under 100%. In the long run, he is targeting a combined ratio of 96%.
Investment Income
Warren Buffett insists on safety over return when it comes to Berkshire’s cash equivalents. Despite worries over the debt ceiling, treasury bills still represent the safest place to park cash. Rising interest rates over the past year have dramatically boosted Berkshire’s interest income, as we can see from this summary from the 10-Q:
Berkshire continues to earn substantial dividend income from its portfolio of equity securities, although the increase in dividends over the past year has been relatively muted. Berkshire has minimal holdings in longer term fixed-maturity investments, as I discussed in detail in an article published in March. The short duration of the fixed-maturity portfolio has limited losses due to rising interest rates. Berkshire carries its fixed-maturity securities at fair market value with amortized cost of the $22.5 billion portfolio approximating carrying value at the end of the first quarter.
Market participants currently believe that the Federal Reserve will begin cutting rates this year. As a result, longer term rates for treasuries are substantially below short term rates, a condition known as an inverted yield curve. Berkshire concentrates its cash holdings in three to six month treasury bills and it is possible that we will see interest income peak sometime later this year if the Fed actually begins to cut rates.

With Mr. Buffett expecting operating earnings at many of Berkshire’s businesses to decline in 2023, an increase in overall operating earnings for the year will depend on investment income acting as an offset. Even if the Federal Reserve begins to cut rates later this year, it seems likely that interest income will compare favorably against 2022 for the rest of 2023. I will not hazard a guess regarding what 2024 will bring.
Railroad
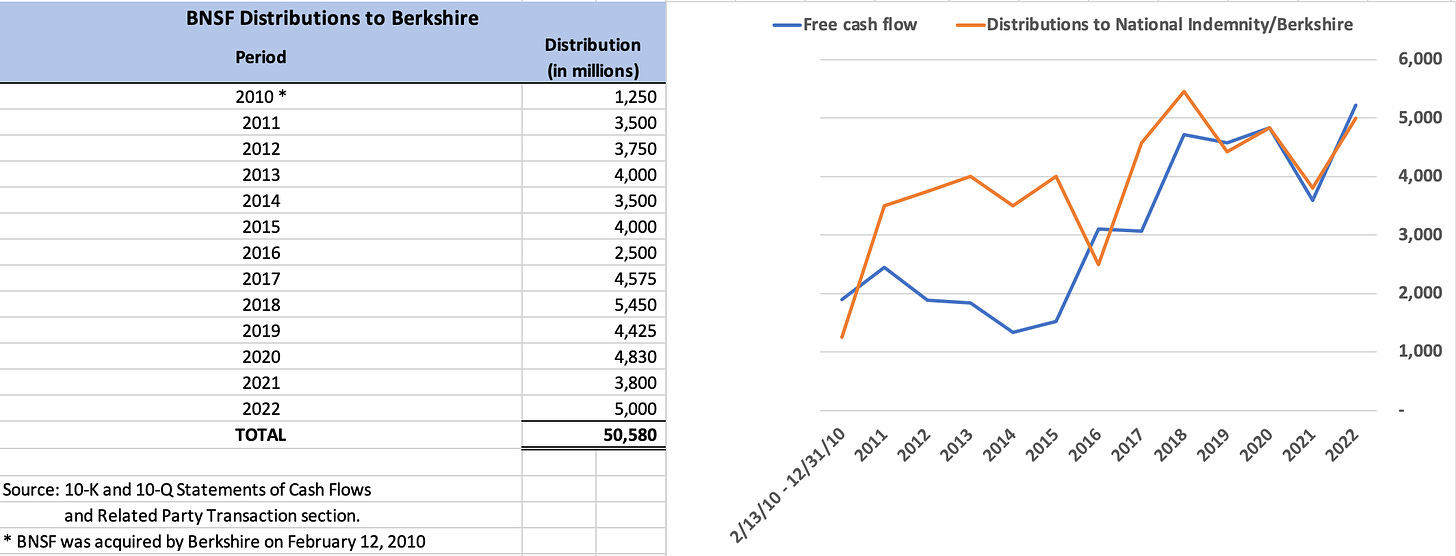
Berkshire acquired BNSF in 2010. In August, I published a profile of BNSF which goes into detail regarding the business model and recent results of the railroad. Over the years, BNSF has returned over $50 billion in cash distributions. Berkshire has recovered far in excess of its cash outlay for BNSF in the years since the acquisition.
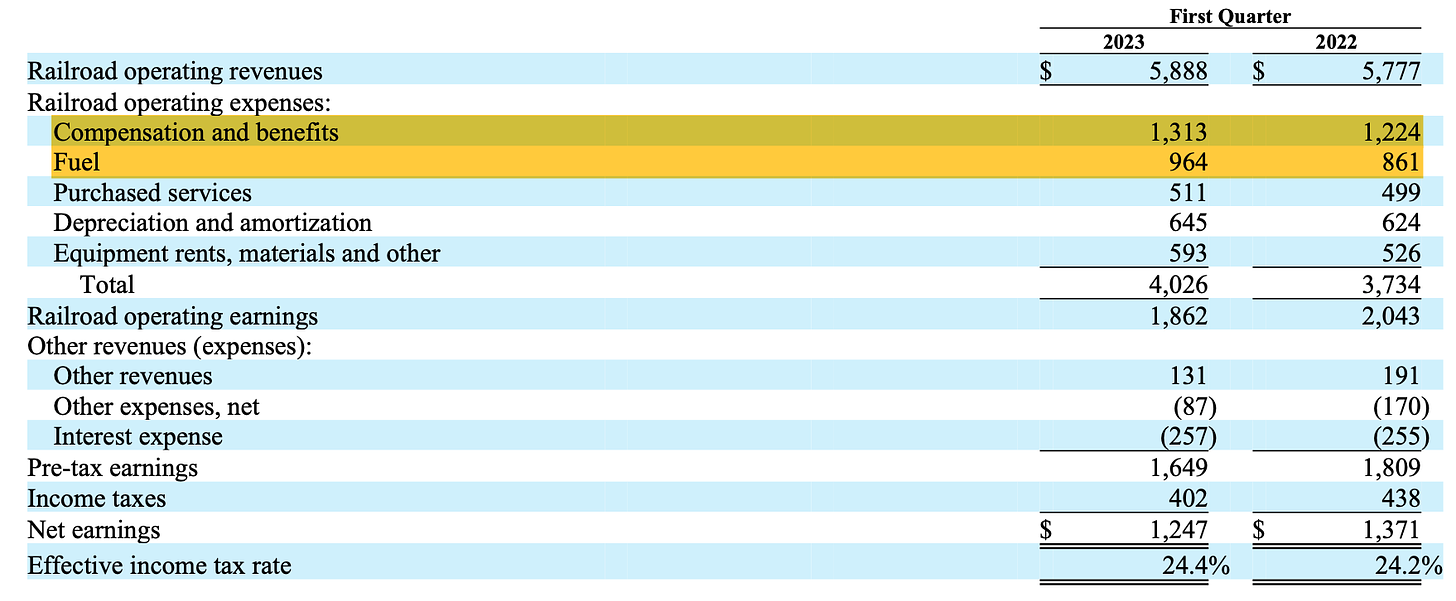
While the long term results from BNSF have been quite satisfactory, results were weak during the first quarter. The railroad’s operating ratio, representing the ratio of operating expenses to operating revenues, increased 3.8% to 68.4% compared to the first quarter of 2022. In contrast, Union Pacific’s operating ratio for the first quarter was far lower at 62.1%. BNSF was impacted by rising compensation and fuel costs:
Physical volume represented by carloads declined across the board:
Management noted that the steep decline in consumer products was primarily due to lower intermodal shipments partly caused by the loss of an intermodal customer. Volume decreased in all product categories. Operating revenues increased compared to the first quarter of 2022 due to a 14% increase in average revenue per car/unit.
There is not much management can do about lower volumes of shipments and it looks like rates are being increased fairly aggressively. However, this is being offset by rising expenses. At the annual meeting, Greg Abel expressed a long term oriented mindset when it comes to measuring the railroad’s performance. However, the wide gap in the operating ratio between BNSF and Union Pacific is cause for concern.
If BNSF could narrow the gap with Union Pacific by just half, that would imply a ~65% operating ratio. This would have increased pre-tax earnings by $200 million during the first quarter compared to actual results. I wrote a profile of Union Pacific in October 2022 which may be of interest to readers interested in more details. Berkshire is correct to focus on the long run, but it is appropriate for shareholders to compare BNSF’s results to Union Pacific given their geographic overlap.
Manufacturing, Service and Retailing
Berkshire Hathaway has numerous non-insurance operating businesses consolidated into the Manufacturing, Service and Retailing group. Results for the first quarter appear in the exhibit below:
I will not attempt to describe each of the businesses within this group, but will present a few exhibits that I think illustrate recent trends at a high level. The exhibit below shows revenue and earnings for the group over the past twelve quarters:
Pre-tax margins of each category within the MSR group, appears below:
For the first quarter of 2023, Berkshire reported higher earnings in the industrial products group while showing declines in building products and consumer products. Precision Castparts, Lubrizol, Marmon, and IMC all reported higher revenue and pre-tax earnings. Within building products, Clayton Homes reported lower new home unit sales partially offset by higher average selling prices. Higher interest rates have dampened housing-related activity and management expects continued softness for the remainder of 2023. In consumer products, Forest River’s recreational vehicle business reported a 44% decline in unit sales as rising interest rates took a toll on business. These are just a few areas in this huge group of businesses that jumped out at me. Readers who are interested in a detailed breakdown should review pages 38 to 42 of management’s discussion in the 10-Q.
Pilot Travel Centers
On October 3, 2017, Berkshire Hathaway acquired 38.6% of Pilot Travel Centers which operates a large network of Pilot and Flying J branded travel centers in 43 states and six Canadian provinces. Pilot’s most significant business involves purchasing and selling fuel on a wholesale and retail basis. The business is characterized by high revenues and relatively low margins.
The agreement entered into in 2017 called for Berkshire to purchase an additional 41.4% interest in 2023. This interest was purchased on January 31, 2023 for approximately $8.2 billion bringing Berkshire’s ownership interest to 80%. The implied valuation of the business is approximately $19.8 billion. 20% of Pilot is owned by the Haslam family which has the option to require Berkshire to redeem their interest for cash starting in 2024.
In connection with acquiring the 41.4% interest in January, Berkshire recorded a one-time, non-cash remeasurement gain of $3 billion on the 38.6% interest purchased in 2017. That original interest was accounted for under the equity method of accounting. Now that Berkshire controls 80% of Pilot, the business has been consolidated in Berkshire’s financial reporting starting on February 1, 2023.
Due to the nature of Pilot’s business, it has been classified within Berkshire’s railroad, utilities, and energy section of the balance sheet and income statements.
The following exhibit shows Pilot’s results for the entire quarter even though only February and March were actually included in Berkshire’s consolidated results:
To provide a sense of the scale of the business, it’s interesting to note that Pilot sold approximately 4.7 billion gallons of diesel fuel and gasoline during the quarter. Management notes that fuel prices and margins were elevated in 2022 and the first quarter of 2023. During the annual meeting, Mr. Buffett stated that Pilot’s business was very good in 2022 which caused Berkshire to pay a relatively high price for the 41.4% interest. Berkshire would have preferred to purchase the entire business in 2017, but it was not on sale in full at that time. It will be interesting to monitor this latest addition to Berkshire’s large collection of energy-related businesses over time.
Repurchase Activity
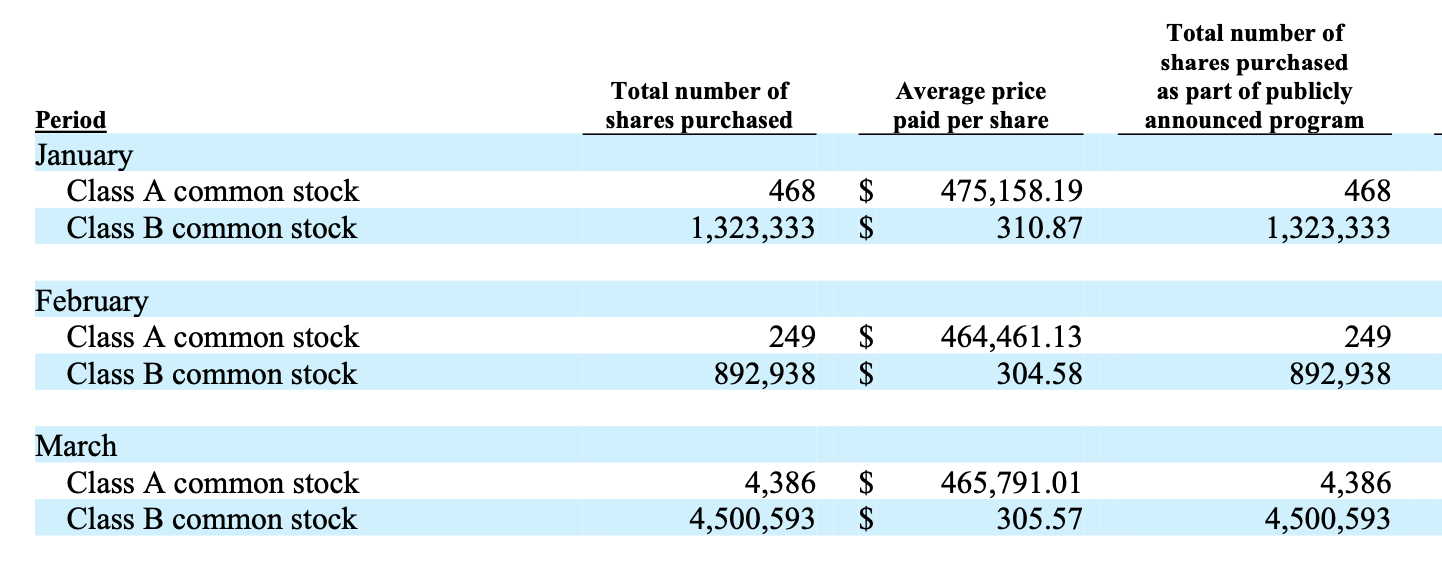
Berkshire reported the following repurchase activity for the first quarter:
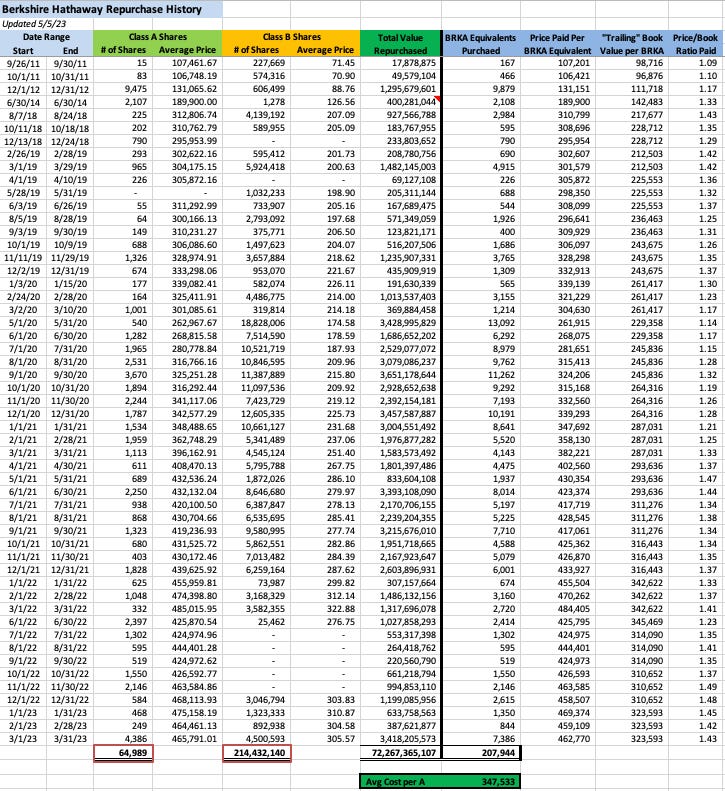
Based on the data in the table, we can see that 5,103 Class A shares and 6,716,864 Class B shares were repurchased during the first quarter for $4,439 million. The average cost per Class A equivalent share was roughly $463,400. This is equivalent to 1.33x book value of $347,932 per Class A equivalent share as of March 31, 2023.
The first page of Berkshire’s 10-Q provides a count of shares outstanding as of April 25, 2023. There were 1,449,829 Class A equivalent shares outstanding on April 25 compared to 1,450,152 on March 31, indicating that Berkshire repurchased 323 Class A equivalents between April 1 and April 25. This likely cost between $150 to $160 million, indicating that Berkshire slowed its repurchase pace compared to March.
Berkshire has allocated $70.5 billion toward repurchases since August 2018 when its repurchase policy was amended to remove self-imposed constraints related to book value. At the time of the amendment, I wrote the following:
Berkshire’s amended program increases the probability that the company will continue serving as a means of compounding wealth with minimal tax consequences for years to come. Longtime shareholders benefit from the “float” represented by their personal deferred tax liability. As long as they avoid selling shares, the deferred tax liability “works” on their behalf and continues compounding. The beauty of being able to compound wealth using not only your capital but deferred tax liabilities cannot be overstated.
I’ve presented the following table several times in recent years and it is getting too long to continue presenting in this format for much longer (click on the image for a larger view). It shows all repurchases since repurchases began in September 2011:
Note that the number of A and B shares in my spreadsheet (in red boxes) matches the number of shares of treasury stock Berkshire reports in Note 19 of the 10-Q:
The case for stock buybacks continues to be very compelling despite a new 1% federal tax on repurchases that went into effect this year. I submitted a question about the repurchase tax but it was not selected during the annual meeting. It is doubtful that a 1% tax will impact Warren Buffett’s decisions on returning capital. Repurchases are still far more tax efficient compared to dividends.
Conclusion
Berkshire Hathaway is off to a strong start for 2023. Although the company trades as one stock (with two share classes), Berkshire is really a highly diversified group of businesses that do not perform in lockstep in all economic environments. Berkshire shareholders have a large amount of diversification in a single holding.
Warren Buffett expects lower operating earnings for most of Berkshire’s businesses for the full year but higher investment income is likely to more than make up for this and deliver higher operating earnings compared to 2022.
But there are important caveats.
A major catastrophe is Florida could easily upend this benign outlook. During the annual meeting, Ajit Jain stated that Berkshire could suffer a loss of up to $15 billion if a major hurricane strikes Florida in the wrong place (presumably the Miami region). Berkshire is willing to take on large risks that no other insurer would touch, accepting volatility in exchange for long term underwriting profits.
Keep your eyes on the National Hurricane Center’s website this summer!
Warren Buffett never comments on Berkshire’s valuation but we can watch his actions when it comes to repurchases. I believe him when he says that he will only repurchase stock “below Berkshire’s intrinsic value, conservatively determined.” Those who are interested in Berkshire’s valuation would be better served watching what Mr. Buffett does when it comes to repurchases rather than seeking the opinion of analysts!
If you found this article interesting, please click on the ❤️️ button and consider sharing it with your friends and colleagues or on social media.
Copyright, Disclosures, and Privacy Information
Nothing in this newsletter constitutes investment advice and all content is subject to the copyright and disclaimer policy of The Rational Walk LLC.
Your privacy is taken very seriously. No email addresses or any other subscriber information is ever sold or provided to third parties. If you choose to unsubscribe at any time, you will no longer receive any further communications of any kind.
The Rational Walk is a participant in the Amazon Services LLC Associates Program, an affiliate advertising program designed to provide a means for sites to earn advertising fees by advertising and linking to Amazon.com.
Individuals associated with The Rational Walk own shares of Berkshire Hathaway.
In Q1 2023, Berkshire implemented an accounting rule change related to long-duration insurance contracts. This resulted in retrospective revisions to Berkshire’s income statements for 2021 and 2021 detailed in Item 5 of the 10-Q on page 49. I have not retrospectively changed any of my spreadsheets. As a result, the figures in all exhibits are presented as originally reported. I do not believe that the change materially changes any of my conclusions regarding Berkshire’s insurance operations.









Sheesh. I had a sailboat for a few years in Florida and the Bahamas, and I was constantly trying to dodge hurricanes, one time unsuccessfully and ended up with a damaged boat. I’m biased, but that sure seems like a scary risk. But they obviously know what they are doing, so I will attempt to ignore it and not worry. 😬
I didn’t realize we were on the hook for $15 billion in Florida. Do you know what the main exposure is? This seems like a pretty big probability for a payout due to hurricanes gaining in strength the last few years.