Berkshire Hathaway's 2023 Results — Overview
A 30,000 foot view of 2023 results
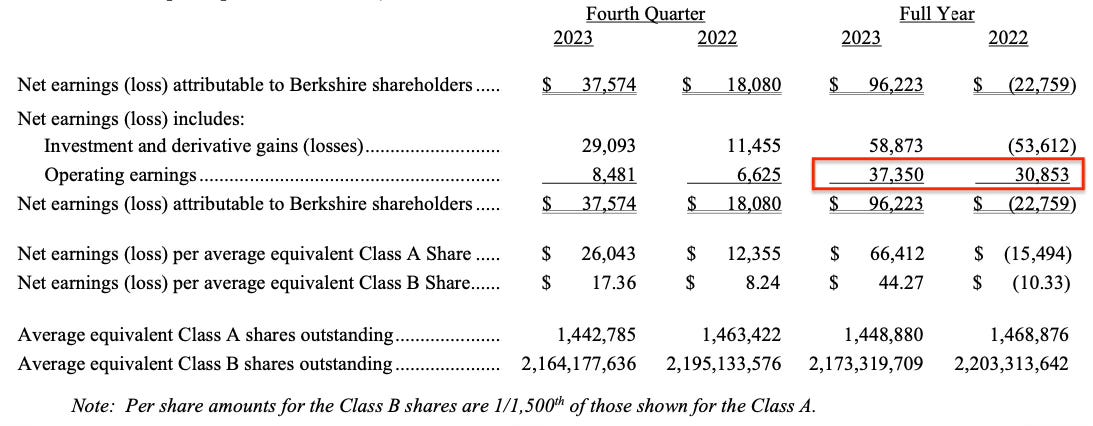
Berkshire Hathaway reported net income of $96.2 billion attributed to Berkshire shareholders for 2023, the highest annual net income figure ever posted by the company. In comparison, Berkshire posted a net loss of $22.8 billion for 2022 and net income of $89.9 billion for 2021.
What in the world is going on?
Many businesses post volatile underlying results and accounting rules do not always present an accurate portrayal of a business. But these swings seem extreme, especially for a company like Berkshire Hathaway. As Berkshire’s press release points out, net earnings figures are heavily influenced by changes in the unrealized gains and losses of the company’s massive portfolio of marketable equity securities. Since accounting rules changed in 2018, Berkshire’s quarterly and annual results have been hopelessly skewed by the vagaries of Mr. Market’s short-term emotions.
To provide the public with a more sensible high-level view of results, we are presented with a breakdown of net earnings between operating earnings and earnings related to investment gains and losses. We can see that Berkshire’s net operating earnings rose from $30.9 billion in 2022 to $37.4 billion in 2023.
In 2023, Berkshire posted net earnings attributable to investment and derivative gains of $58.9 billion compared to a net loss of $53.6 billion in this category for 2022. This massive swing, the majority of which is related to changes in market quotations of securities that Berkshire did not sell during these periods, is the cause of the large swings in net income that confuse many reporters and investors.1
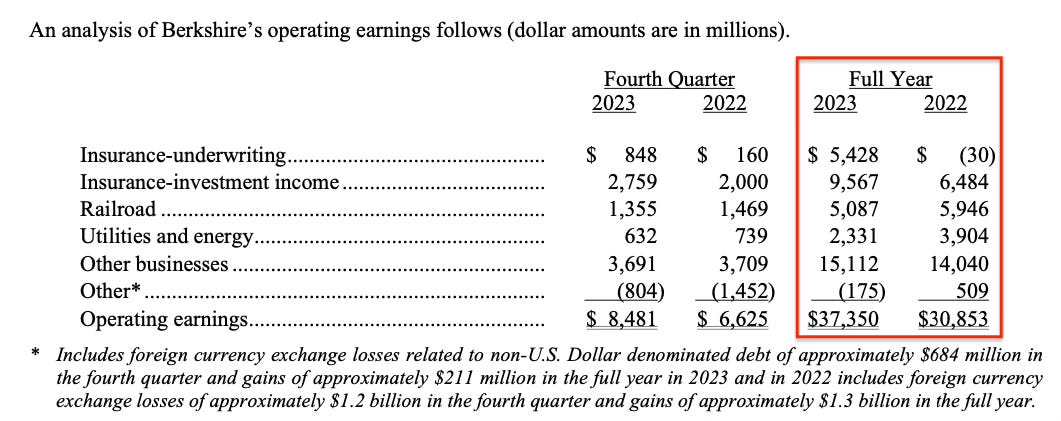
Berkshire’s press release further breaks down operating earnings so readers can get a sense of the performance of the conglomerate’s different sectors. While this is an insufficient substitute for the details found in the annual report, it is still useful:
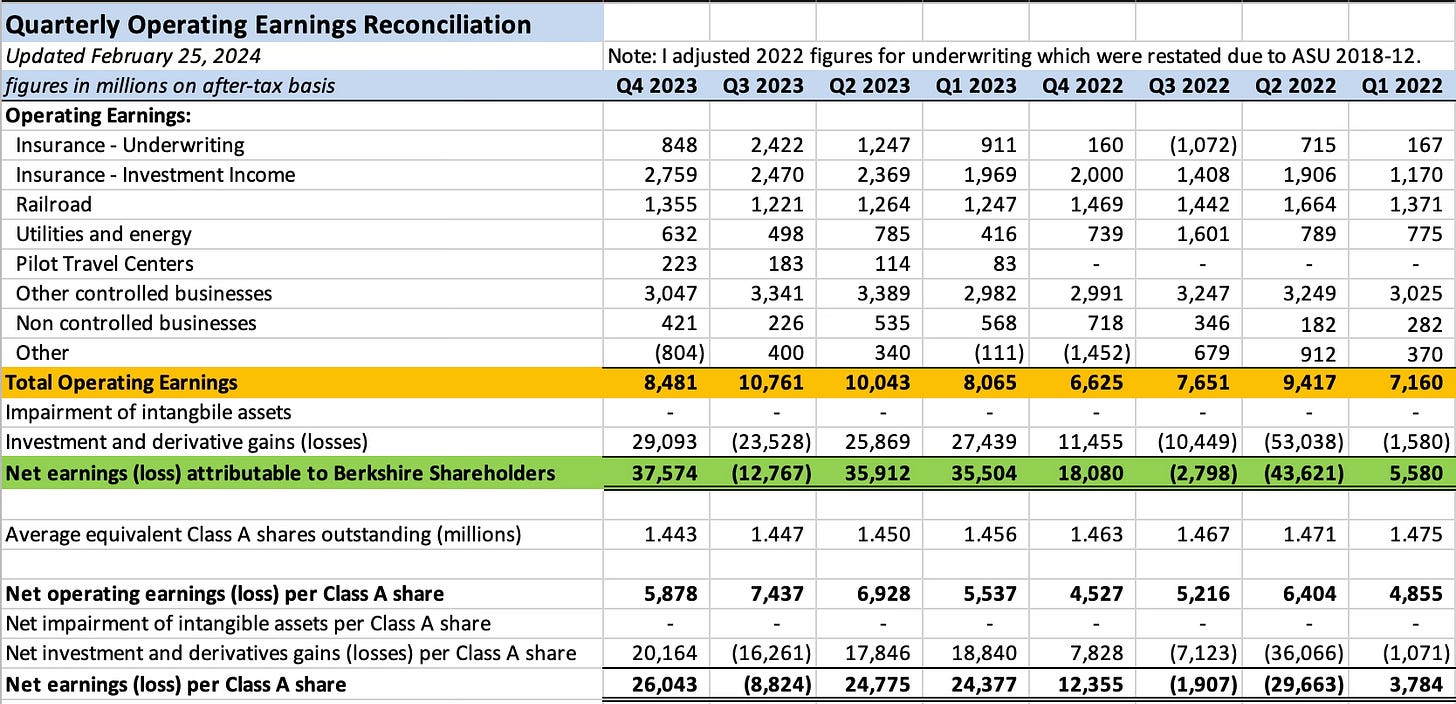
It is also useful to look at quarterly volatility, which is even more extreme than when we look at the annual figures. The exhibit below shows Berkshire’s net operating earnings compared to net earnings over the past eight quarters.2
While many companies encourage shareholders to focus on non-GAAP measures for nefarious reasons, it should be quite clear that we must look at operating earnings at Berkshire rather than net earnings if we hope to gain any real insight into the progress of the business. Otherwise, we will oscillate from delight to terror, quarter to quarter, simply due to stock market fluctuations that have little meaning. In the long run, of course, Berkshire’s investments in marketable securities play a very important role in the company’s value, but we are better off ignoring these moves in the short run, unless there are extraordinary developments taking place in the investees.
Operating Income
Let’s turn our attention to a “30,000 foot” high level review of the major components of Berkshire’s operating income.
Insurance Underwriting
Berkshire’s insurance group swung from a small underwriting loss in 2022 to an underwriting profit of $5.4 billion in 2023 thanks primarily to a strong turnaround at GEICO which posted a $3.6 billion pre-tax underwriting gain in 2023 compared to a $1.9 billion pre-tax underwriting loss in 2022. Berkshire Hathaway’s primary and reinsurance groups also posted stronger underwriting results, in the latter case helped by fewer large catastrophe events in 2023 compared to 2022.
Investment Income
Investment income jumped to $9.6 billion in 2023 from $6.5 billion in 2022 due to the impact of higher short-term interest rates on Berkshire’s large investment in treasury bills. Dividend income declined due to dispositions of dividend-paying stocks since the end of the third quarter of 2022, partially offset by higher dividend rates on investments that Berkshire has continued to hold.
At the end of 2023, Berkshire held a record $163.3 billion of cash and short-term treasury bills excluding cash held in the railroad and utility businesses. Of this amount, $121.9 billion of cash and treasury bills were held within the insurance subsidiaries, along with $23.6 billion of interest-bearing fixed-maturity investments:
Railroad
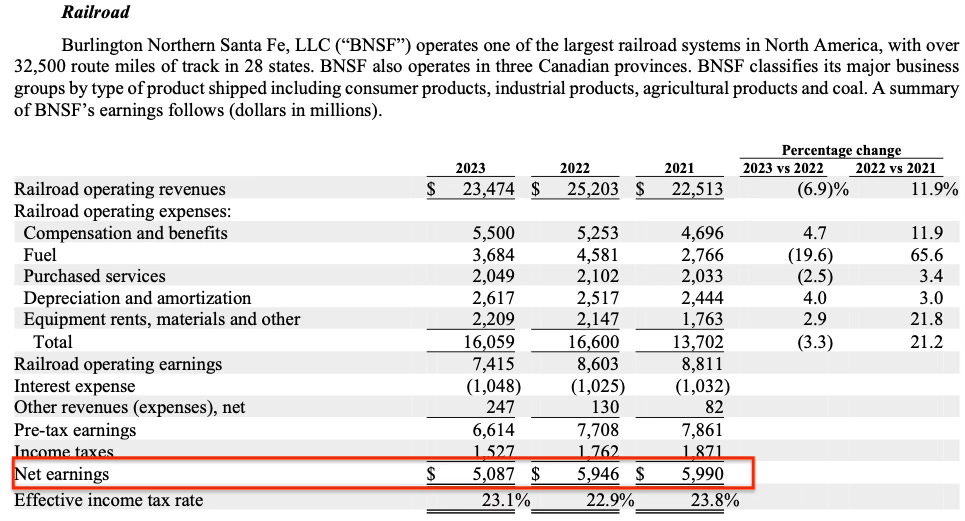
BNSF’s net earnings declined to $5.1 billion in 2023 compared to $5.9 billion in 2022. Operating revenues declined by 6.9% in 2023 due primarily to a decline in freight volume as well as slightly lower average revenue per car/unit. The railroad’s operating ratio increased to 68.4% in 2023 compared to 65.9% in 2022.3
Warren Buffett was not pleased with BNSF’s performance based on these comments in his annual letter to shareholders.
“Though BNSF carries more freight and spends more on capital expenditures than any of the five other major North American railroads, its profit margins have slipped relative to all five since our purchase. I believe that our vast service territory is second to none and that therefore our margin comparisons can and should improve.”
Utilities and Energy
Berkshire Hathaway’s large energy group was another weak area in 2023 due to litigation costs associated with western wildfires in recent years as well as sharply lower results in the company’s real estate brokerage operations:
Warren Buffett characterized BHE’s results as a “severe” disappointment and seemed to call into question the longstanding pact between investors and regulators that has characterized satisfactory returns in the industry for decades. Mr. Buffett also referred to the future of the utility industry as “ominous” and acknowledged that he did not consider the possibility of such regulatory adversity:
“Whatever the case at Berkshire, the final result for the utility industry may be ominous: Certain utilities might no longer attract the savings of American citizens and will be forced to adopt the public-power model. Nebraska made this choice in the 1930s and there are many public-power operations throughout the country. Eventually, voters, taxpayers and users will decide which model they prefer.
When the dust settles, America’s power needs and the consequent capital expenditure will be staggering. I did not anticipate or even consider the adverse developments in regulatory returns and, along with Berkshire’s two partners at BHE, I made a costly mistake in not doing so.”
Pilot Travel Centers
Starting in February 2023, Berkshire began to account for its investment in Pilot as a consolidated subsidiary when its purchase of an additional 41.4% interest in the business brought its total ownership stake to 80%. Prior to that date, Pilot was accounted for as an equity method investment.
Net earnings from Pilot as a consolidated subsidiary came in at $603 million:
Pilot’s pre-tax earnings fell by 54.7% for the full year compared to results in 2022. PTC sold approximately 16.2 billion gallons of diesel fuel, gasoline, and other fuel-related products in 2023 compared to 18.4 billion gallons in 2022. Results were also reduced in 2023 due to depreciation and amortization expense of $832 million in 2023 compared to $436 million in 2022, the result of the application of acquisition accounting.
The change in the accounting treatment of depreciation and amortization was the major point of contention in the lawsuit between Berkshire and the Haslam family which was settled in January 2024 when Berkshire purchased the remaining 20% of the business for $2.6 billion, implying a total valuation of Pilot of $13 billion. This is substantially below the $19.8 billion valuation when Berkshire purchased a 41.4% interest for $8.2 billion in January 2023. The purchase price of the final 20% was based on a multiple of 2023 pre-tax earnings.
Manufacturing, Service, and Retailing
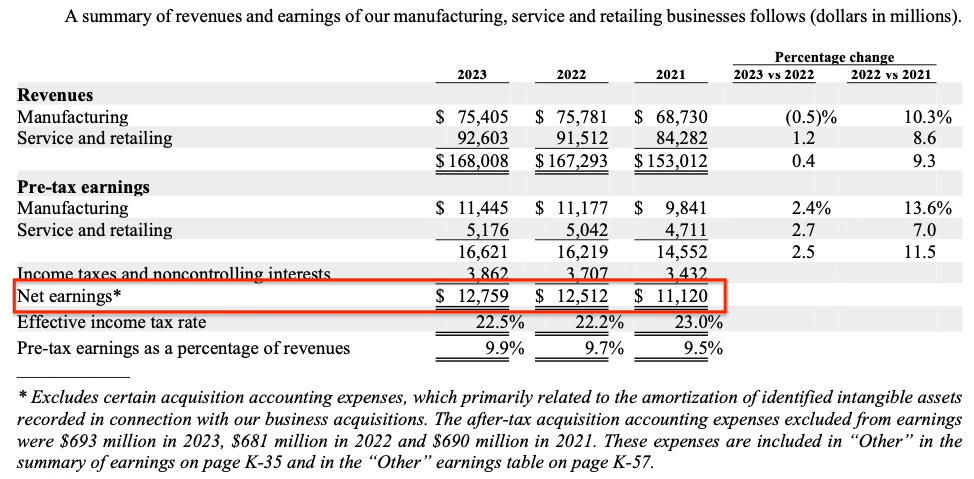
Berkshire’s diverse group of manufacturing, service, and retailing businesses posted net earnings of $12.8 billion in 2023, up from $12.5 billion in 2022. Although revenues were barely higher, margins improved:
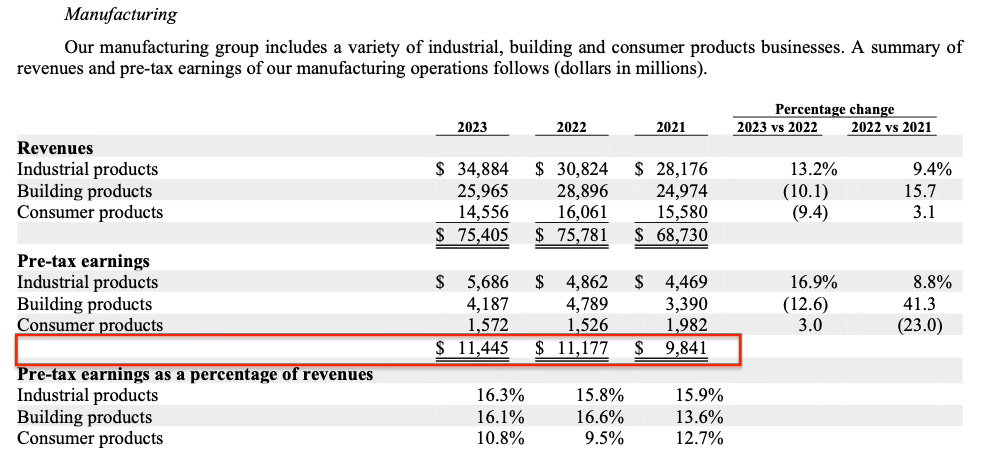
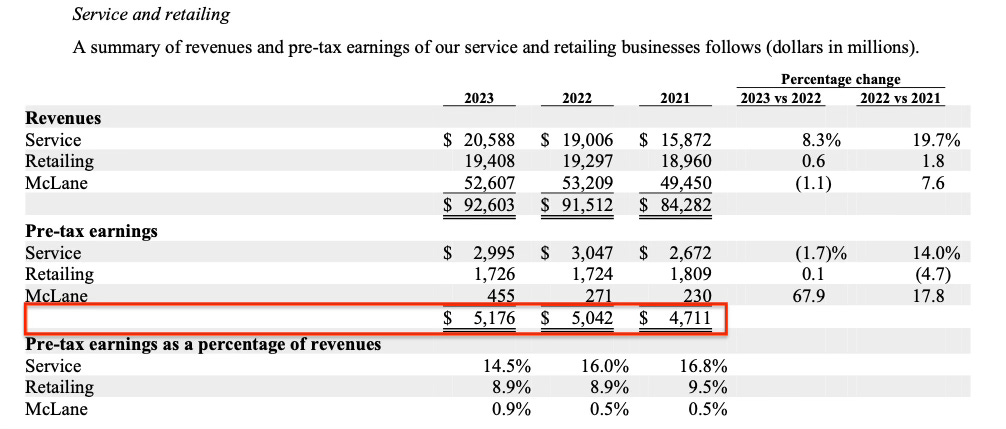
While going into the specific details of this vast array of businesses is not possible in this brief summary article, we can get a sense of the strong and weak points by looking at the breakdown of pre-tax earnings in each of the sectors:
While a deep analysis of this group is beyond the scope of this overview, it might be interesting for readers to see the trend of margins on a quarterly basis for the group.
Berkshire’s Net Worth
Berkshire Hathaway ended 2023 with shareholders’ equity of $561.3 billion, a record high, and a statistic highlighted by Warren Buffett in his annual letter:
“Berkshire now has – by far – the largest GAAP net worth recorded by any American business. Record operating income and a strong stock market led to a yearend figure of $561 billion. The total GAAP net worth for the other 499 S&P companies – a who’s who of American business – was $8.9 trillion in 2022. (The 2023 number for the S&P has not yet been tallied but is unlikely to materially exceed $9.5 trillion.)
By this measure, Berkshire now occupies nearly 6% of the universe in which it operates. Doubling our huge base is simply not possible within, say, a five-year period, particularly because we are highly averse to issuing shares (an act that immediately juices net worth).”
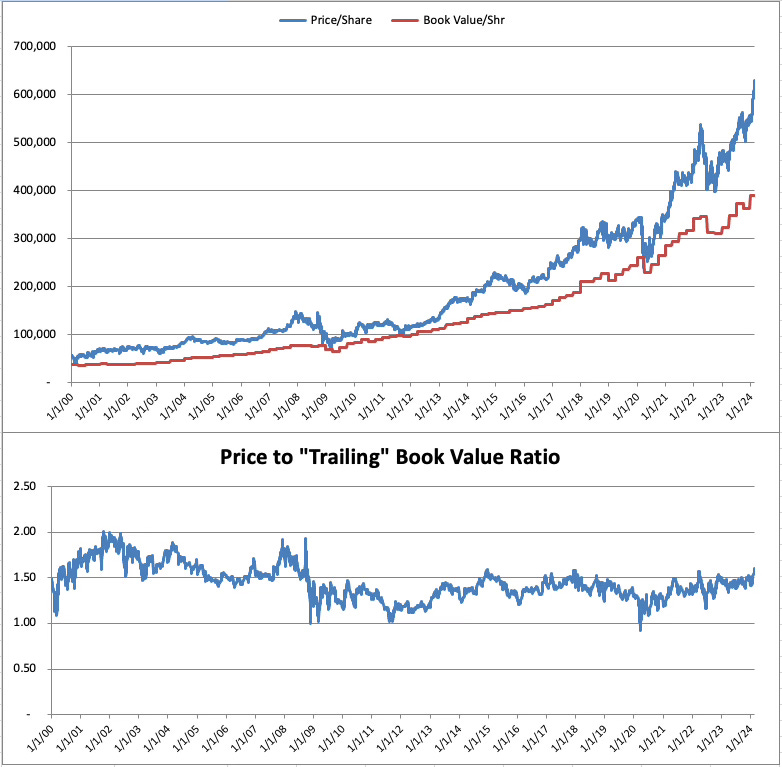
Although Berkshire no longer highlights book value per share, this figure rose to a record $389,372 per Class A equivalent. With Class A shares at $628,930, Berkshire is trading at 162% of book value. The following exhibit shows Berkshire’s price per share, book value per share, and the “trailing” price-to-book ratio since 2000:
Starting in 2019, Berkshire Hathaway’s annual reports no longer make explicit mention of book value per share for reasons that were explained in Warren Buffett’s 2018 annual letter which I commented on in Warren Buffett Moves the Goalposts. For a number of reasons, the positive gap between intrinsic value and book value has grown over time. Readers interested in more details regarding why book value is no longer as useful as it was in the past are encouraged to refer to the links above.
As I mentioned in my article a week ago, Berkshire Hathaway at $600,000, the price-to-book ratio is at a high relative to its level since the financial crisis of 2008, although shares routinely traded at or above current levels prior to the crisis.
Whether shares are trading below, at, or above intrinsic value is a question that shareholders must decide on for themselves. Hopefully this overview has been helpful in terms of putting the headline numbers in a little better context.
I plan to get into the “weeds” on the details of Berkshire’s 2023 results this week. These articles will be for paid subscribers, most likely with a brief free introduction.
If you found this article interesting, please click on the ❤️️ button and consider sharing it with your friends and colleagues.
Thanks for reading!
Copyright, Disclosures, and Privacy Information
Nothing in this article constitutes investment advice and all content is subject to the copyright and disclaimer policy of The Rational Walk LLC.
Your privacy is taken very seriously. No email addresses or any other subscriber information is ever sold or provided to third parties. If you choose to unsubscribe at any time, you will no longer receive any further communications of any kind.
The Rational Walk is a participant in the Amazon Services LLC Associates Program, an affiliate advertising program designed to provide a means for sites to earn advertising fees by advertising and linking to Amazon.com.
Individuals associated with The Rational Walk own shares of Berkshire Hathaway.
In 2023, $53 billion of the investment and derivative gains due to changes in the unrealized gains that existed in the equity securities portfolio. Berkshire also posted $3.6 billion of realized gains in 2023 and there was a non-cash net remeasurement gain of approximately $2.4 billion related to Berkshire’s acquisition of an additional 41.4% interest in Pilot.
Berkshire has changed certain aspects of its operating earnings presentation and an accounting change slightly altered insurance underwriting results for 2022 compared to figures that were originally reported. I have used the restated quarterly figures for 2022 derived from 2023 press releases and quarterly filings. Therefore, underwriting results for 2022 will not agree with the figures originally reported in Berkshire’s press releases and filings for 2022. In my opinion, the change in accounting (ASU 2018-12) is not material from a high level analytical perspective.
A railroad’s operating ratio is defined as operating expenses divided by operating revenue.


