Berkshire Hathaway's 2023 Results — MSR
The manufacturing, service, and retailing group is a consistent source of earnings power in all economic environments, providing ballast in troubled times.
Berkshire Hathaway recently released its 2023 annual report. Earlier this week, I published a free article containing a “30,000 foot view” of recent results.
My original plan was to write just one in-depth article on Berkshire’s results in addition to the free overview, but I have decided to spend more time in order to produce a detailed article on each of Berkshire’s major reporting groups.
Today’s article is a review of Berkshire’s Manufacturing, Service, and Retailing (MSR) group. I will publish additional articles covering Insurance, BNSF, and BHE. I plan to send out one article per week for the next three weeks.
“One investment rule at Berkshire has not and will not change: Never risk permanent loss of capital. Thanks to the American tailwind and the power of compound interest, the arena in which we operate has been – and will be – rewarding if you make a couple of good decisions during a lifetime and avoid serious mistakes.”
— Warren Buffett, 2023 letter to shareholders
Ballast in Troubled Times
Four years ago, the world was just starting to come to grips with the implications of the pandemic. We were on the verge of an event that was truly unprecedented in modern times and it is fair to say that no one knew what to expect.
In Berkshire Hathaway and the Coronavirus Crash, published on March 22, 2020, I wrote about my thoughts regarding the company’s prospects in an economy crippled by government shutdowns. My focus was on risk and preservation of capital:
“Despite the inability to be precise, it seems to me that it is highly unlikely for Berkshire’s operating earnings to be negative or operations, in aggregate, to consume cash for any length of time. If there are quarters in which there are operating losses for the group as a whole, Berkshire certainly has ample cash resources to avoid any kind of financial distress.”
I was under no illusions that Berkshire’s value would be unscathed compared to its normal prospects in a benign environment in which the pandemic had never taken place, but my concerns about financial distress were alleviated based on my review:
“Berkshire is positioned as well as any company could be facing this type of exogenous shock to the system. While survival of the company is not in question, the long term intrinsic value of the business certainly is in question because we could be in the early stages of an economic depression. If that occurs, then the long term value of nearly every business in the country will be impaired.”
When I wrote the article, I had no inkling that the stimulus-driven economy would recover as quickly as it did and I had even less of a clue regarding the stock market’s V-shaped recovery following the March lows. I refused to panic but I did sell one company that I had less confidence in. With the after-tax proceeds, I increased my investment in Berkshire on April 2, 2020 and I still hold those shares today.
My confidence in Berkshire during troubled times was not based on a conviction that the stock would avoid a short-term decline. It was based on the earnings power the company has in all economic environments. Berkshire’s large portfolio of equity securities is volatile and insurance underwriting can swing to losses in the short run. But Berkshire’s Manufacturing, Service, and Retailing (MSR) group is capable of generating reliable earnings quarter after quarter, even in very challenging times.
With the MSR group, along with BHE and BNSF, not to mention Berkshire’s vast holdings of cash and treasury bills, there was virtually no risk of financial distress even in a multi-year depression. The stock could have certainly fallen substantially, but this was a risk common to the market overall. The company would surely continue to exist and live to participate in the eventual economic recovery. Berkshire Hathaway did not have the dreaded “multiply by zero” risk which makes recovery impossible.
Operating Earnings
Before diving into the MSR group, let’s step back for a moment and look at the trends in Berkshire’s overall operating earnings since 2018 which provides a full view of the effects of the pandemic on the company as a whole.
My standard practice is to review Berkshire’s operating results every quarter, but I do so on a trailing twelve month (TTM) basis. Doing this smooths out short-term and seasonal variations in quarterly results and provides a longer term picture. We are provided full year results and comparisons in annual reports but we must calculate TTM figures at the end of the first, second, and third quarters.
For example, when first quarter 2024 results are released in early May, I will aggregate results for the second, third, and fourth quarters of 2023 and the first quarter of 2024. This will represent a full year of results from April 1, 2023 to March 31, 2024.
There is nothing revolutionary about looking at a business in this way, but I am not aware of many companies that present statistics to shareholders in this manner and I almost never read media articles about Berkshire with a focus on TTM figures. I think that it is more useful to look at the company’s progress in this way instead of dwelling on quarterly numbers, either on a sequential or year-over-year basis.
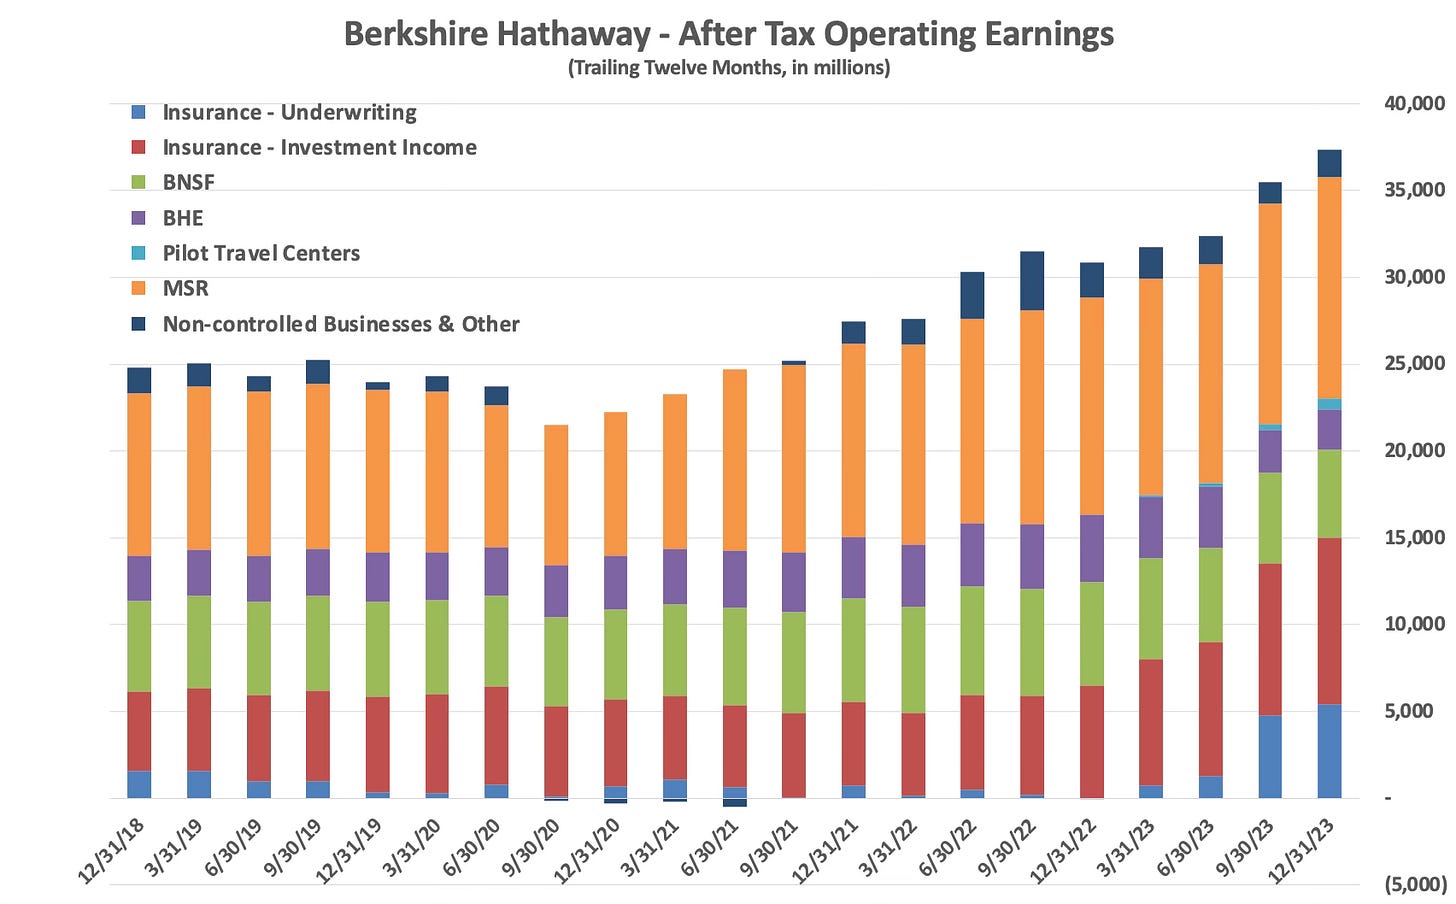
The exhibit below shows after-tax operating earnings on a TTM basis for periods ending from December 31, 2018 through December 31, 2023:
Operating earnings for 2019 came in at $23,972 million. From my perspective in March 2020, I expected operating earnings to decline in the coming quarters as a result of the pandemic. This turned out to be the case, but the decline was mild. On a TTM basis, operating earnings bottomed out in the third quarter of 2020 and began an almost uninterrupted ascent through the end of 2023. The peak-to-trough decline in TTM operating earnings was less than 16%, a very mild impact considering the turmoil taking place in the economy during early months of the pandemic.
Of course, in March 2020, no one knew that the recession would be as mild as it was, primarily due to unprecedented levels of federal government stimulus. If the economy had gone into a multi-year depression, clearly the impact to Berkshire would have been far more severe and the trough in earnings would have come much later. Still, I think that my confidence in March 2020 was justified.
Survival was never in question.
The orange segment of the exhibit above shows the MSR group’s contribution to Berkshire’s operating earnings. The robust nature of MSR was a key reason for my confidence in early 2020. I knew that the group would suffer a decline in operating earnings, but I expected MSR, along with BNSF and BHE, to provide stability for Berkshire at a time when insurance and investments would be under pressure.
The rest of this article goes into more detail on Berkshire’s results for the MSR group, drilling down into each reportable segment within the group: Industrial Products, Building Products, Consumer Products, Service, Retailing, and McLane.
While top line growth in the MSR group has been disappointing lately, earnings have improved at a faster pace than revenues. With pre-tax margins at 9.9% for the MSR group in 2023, up more than two percent from pandemic lows, the question is whether further margin expansion will occur if revenues remain anemic in the years ahead.
MSR Overview
Let’s begin with an overview of revenues, earnings, and margins for the entire MSR group on a TTM basis since the end of 2018. Following this overview, we will drill down into the results of each segment within the group for the same period.
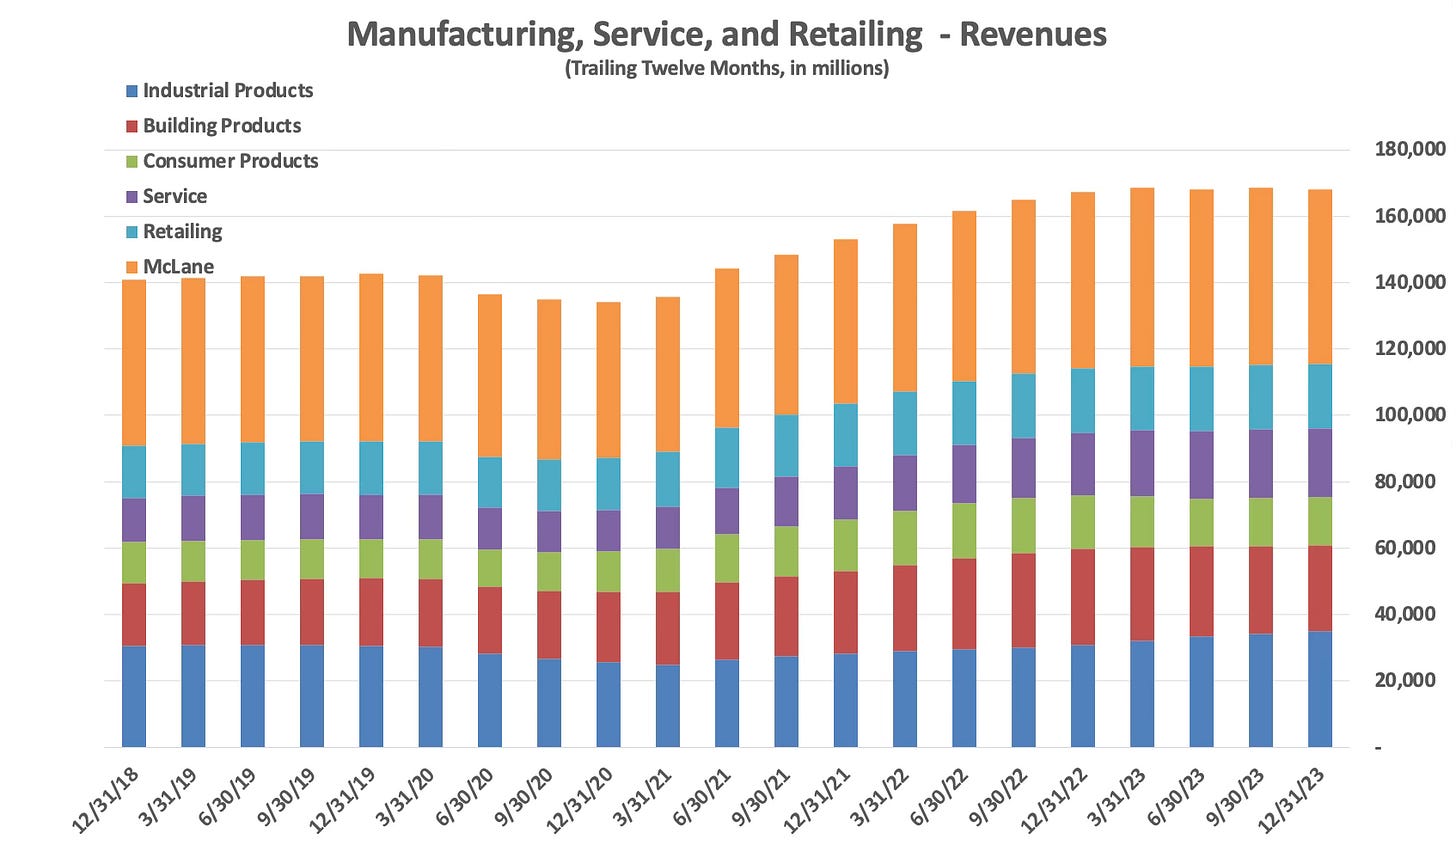
The exhibit below displays the TTM revenue contribution of each of the reporting segments within MSR over the past five years:
Revenues declined from $142,675 million in 2019 to $134,097 million in 2020, or 6%. Revenue was $153,012 million in 2021, $167,293 million in 2022, and $168,008 million in 2023. The revenue decline during the pandemic was mild, but we should note that the recovery slightly underperformed inflation. Revenue increased by 19.3% over the past five years compared to an increase of 22% in the CPI.1
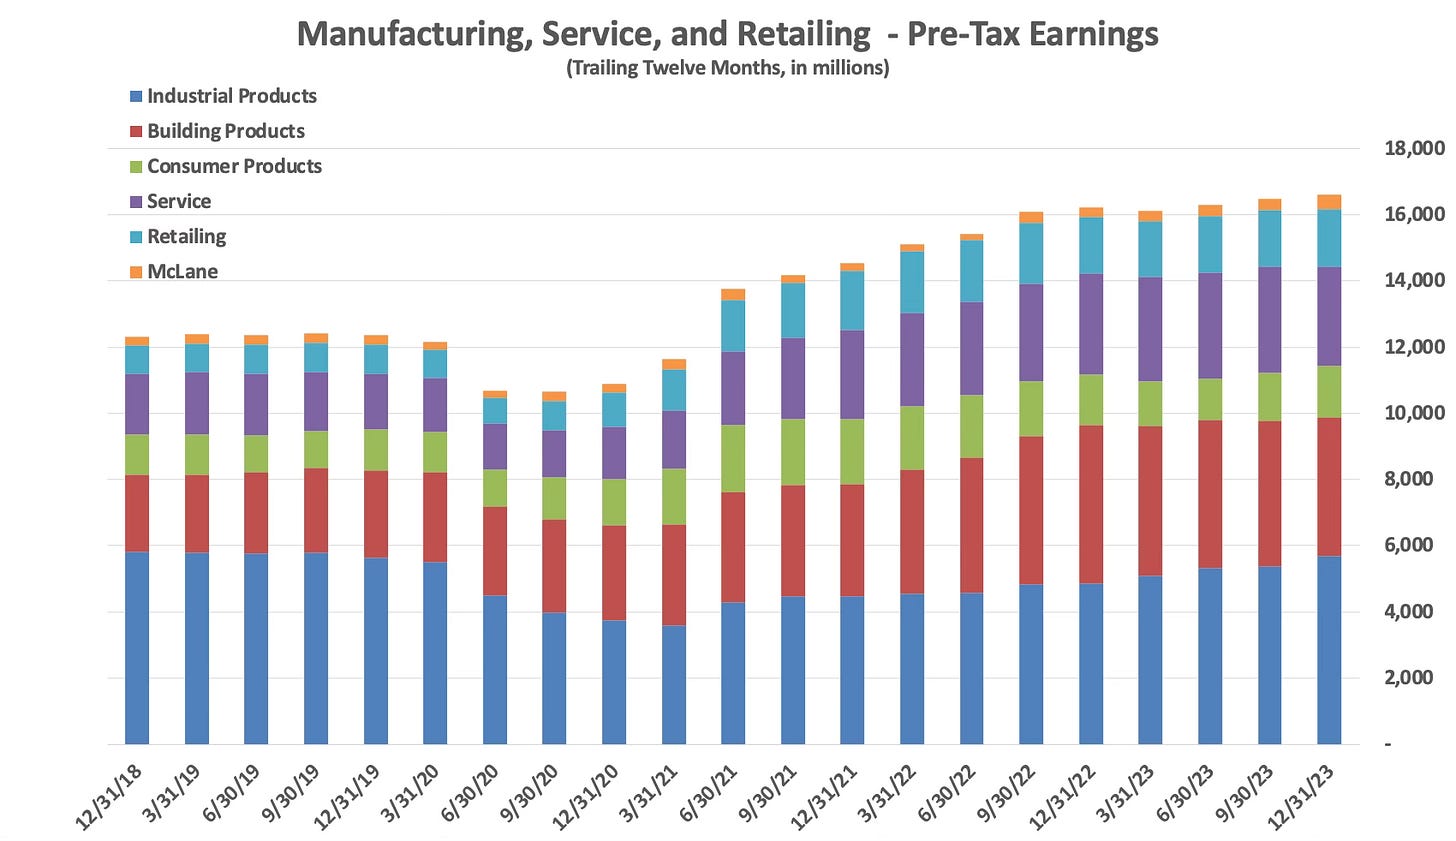
The exhibit below displays the TTM pre-tax earnings contribution of each of the reporting segments within MSR over the past five years:
The MSR group posted pre-tax earnings of $12,365 million for 2019. Pre-tax earnings fell to a trough of 10,650 million for the twelve months ending on September 30, 2020, a decline of 13.9%. Earnings fell by more than revenues due to margin compression, a predictable situation given the inefficiencies related to the pandemic shutdowns as well as operating deleverage. Still, the earnings decline was mild and the recovery was swift. Pre-tax earnings for the group increased by 35% over the past five years, faster than revenues, thanks to significant margin expansion. Earnings outpaced the CPI.
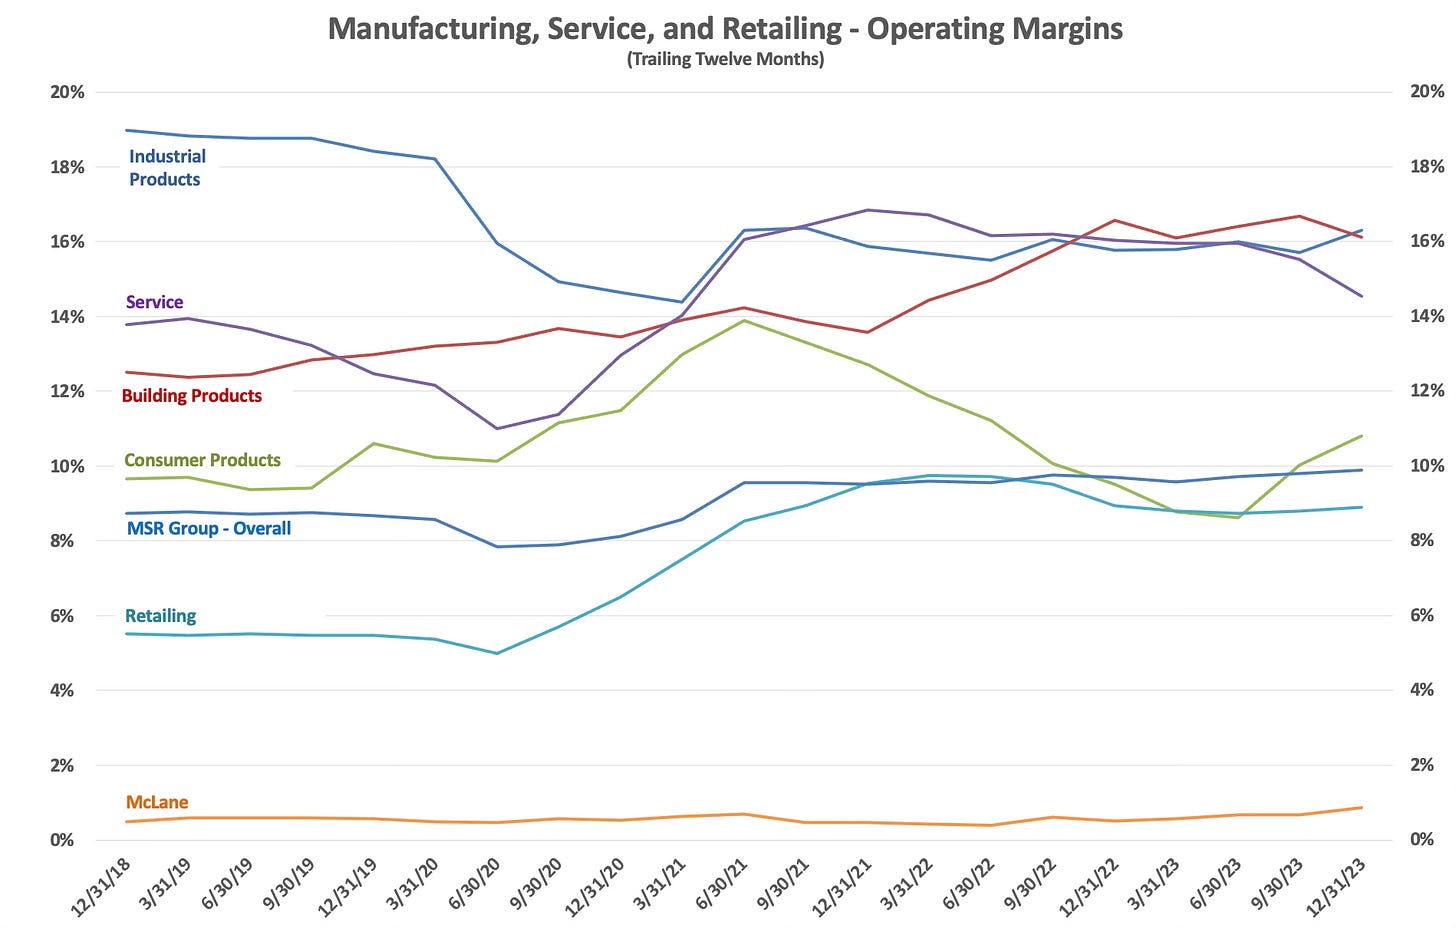
The following exhibit displays operating margins for each segment within the MSR group and for the group as a whole on a TTM basis over the past five years. This should provide an overall sense of the wide differences in margins for each segment, as well as their trends, which will be discussed in more detail later in the article.
Operating margins for the MSR group as a whole expanded from 8.7% to 9.9% over the period. Every segment within MSR experienced margin expansion over this span except for Industrial Products where the margin contracted from 19% to 16.3%.
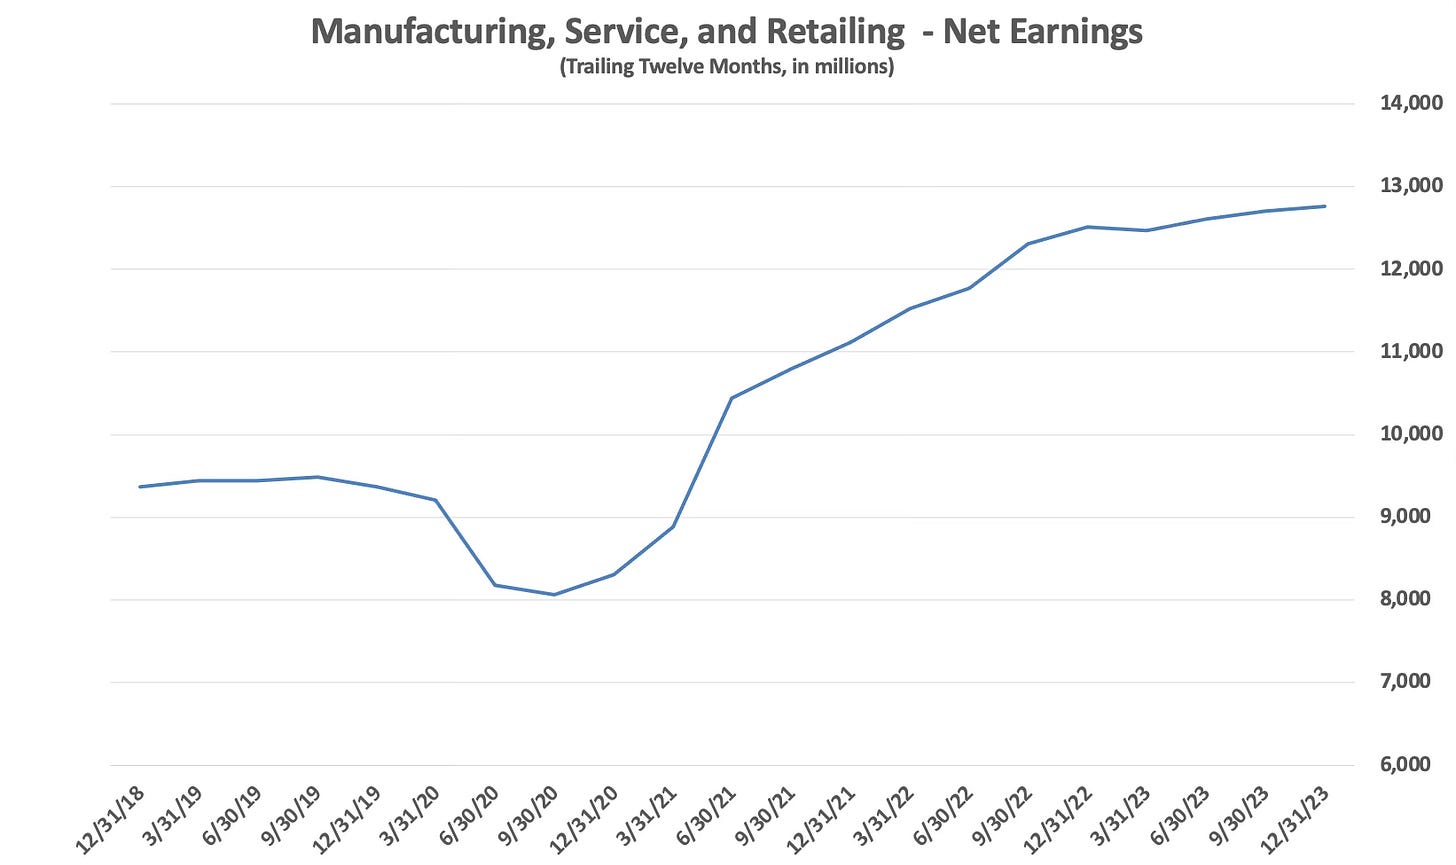
The following exhibit shows MSR’s net earnings on a TTM basis over the past five years. The trend in net earnings follows the trend in pre-tax earnings closely due to an effective tax rate for the group that is relatively stable, ranging from 22.7% to 24.3%. We are provided with net earnings for the entire group only, not for each segment:
Anemic revenue growth is an issue for the MSR group, especially if margins have improved as much as competitive pressures will allow. Under Greg Abel’s leadership since 2018, the group has experienced better results but there is a limit to how much margins can expand in competitive industries.
If MSR revenues can manage to grow at or above nominal GDP growth, net earnings should do the same assuming constant margins and a stable tax rate. But if revenues remain anemic and margins have peaked or contract, earnings power in real terms is at risk of contracting.
As an aside, readers may wonder about return on equity in the MSR group. Warren Buffett’s letters to shareholders included a condensed balance sheet for the group for many years but this disclosure disappeared after the 2016 annual report.
At the end of 2016, MSR had $91.5 billion of equity comprised of $20 billion of tangible equity and $71.5 billion of goodwill and intangibles. In 2016, MSR reported revenues of $120 billion, pre-tax earnings of $8.5 billion, and net earnings of $5.6 billion. The operating margin was 7.2% and the net margin was 4.7%, with return on average equity of 7.6% and return on tangible equity of 24.2%.
Berkshire’s consolidated balance sheet groups “Insurance and Other” into one category making it challenging to determine how much capital is currently employed within MSR, but we can infer that return on equity has improved over the years.
In my opinion, Greg Abel deserves most of the credit for recent performance.
Recent Results by MSR Segment
In this section, I will present TTM revenues and pre-tax earnings for each of the six segments within the MSR group over the past five years. This high level overview is followed by a brief discussion of each segment’s performance in 2023.
Berkshire’s 2023 annual report contains a narrative of 2023 results compared to 2022 on pages K-48 to K-56, so I would not be adding much value to simply repeat all of the details. Instead, I have provided my opinion of key drivers in each segment. Readers are encouraged to refer to the annual report for the full details on 2023 performance.
Manufacturing — Industrial Products
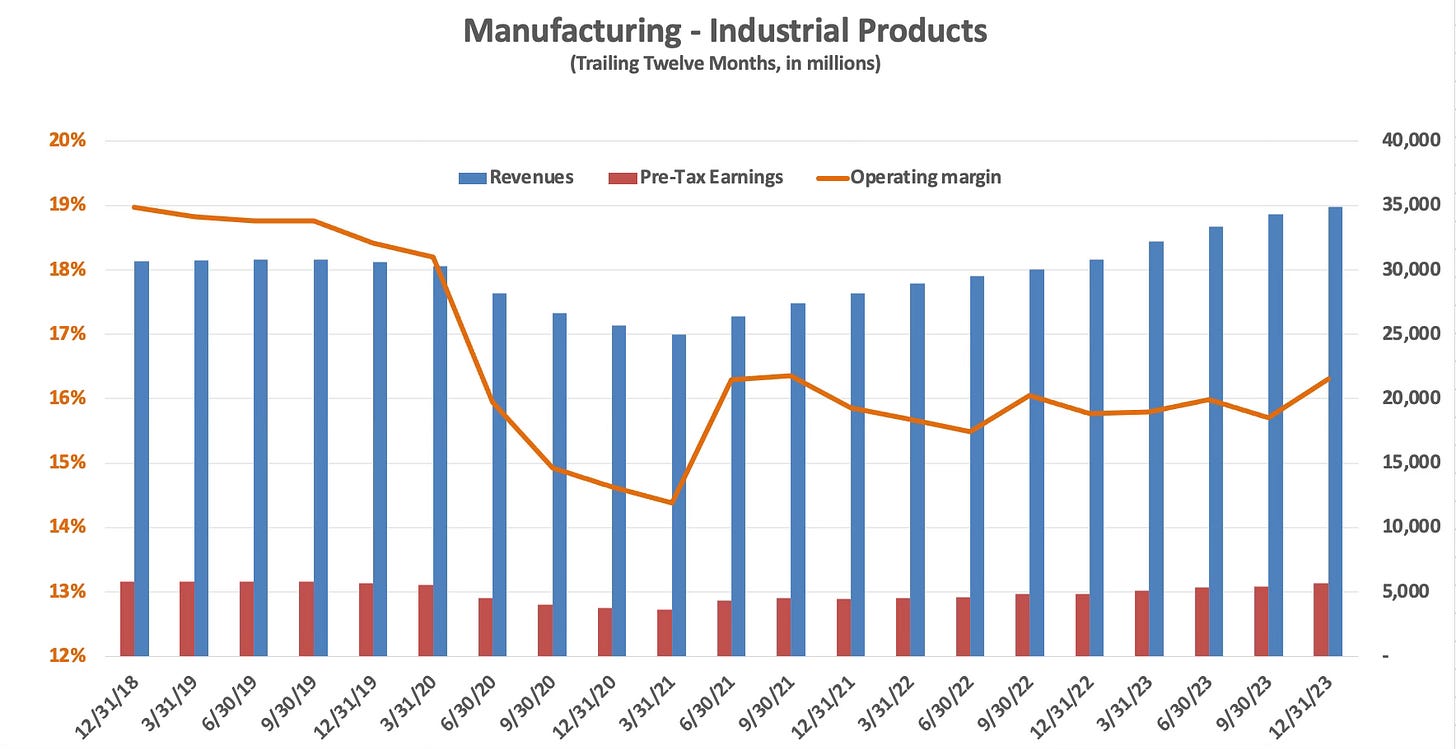
The following exhibit shows revenues, pre-tax earnings, and operating margin for the industrial products segment since 2018 on a TTM basis.
The most important businesses in the industrial products segment are Precision Castparts, Lubrizol, Marmon, and IMC. These businesses accounted for ~91% of industrial products revenue in 2023. Precision Castparts (PCC) alone accounted for 26.7% of the group’s 2023 revenues and 26.4% of pre-tax earnings.
PCC’s faced major difficulties during the pandemic, driven by plummeting demand in the aerospace industry. Berkshire’s disclosures provide limited information on PCC, but I was able to obtain the following data from recent annual reports:
The revenue decline in 2020 predictably destroyed margins, but management’s actions to cut costs, including 40% of the workforce, resulted in a rapid margin recovery. However, PCC is still materially underperforming compared to its record prior to its acquisition by Berkshire in 2015, which resulted in write-downs in 2020.2
The bottom line is that the industrial products segment has improved over the past few years but is still operating below pre-pandemic levels, both in terms of revenues and pre-tax earnings. Operating margins have room for further improvement.
Here are some of the details regarding 2023 results found in the annual report:
Precision Castparts posted revenues of $9.3 billion in 2023, an increase of 13.2% compared to 2022. Pre-tax earnings came in at $1.5 billion in 2023, a 30% increase compared to 2022, reflecting higher margins. Strong demand for aerospace products is expected to continue, so the company’s ability to meet demand while continuing to improve efficiencies will be very important. PCP was acquired in 2016 for $32 billion in cash. In 2020, Berkshire recorded a $9.8 billion write-down of PCP goodwill.
Lubrizol posted revenues of $6.4 billion in 2023, a decline of 4% compared to 2022. Pre-tax earnings were relatively unchanged. Excluding insurance recoveries of $242 million in 2022 in connection with fires at company facilities, earnings in 2023 were higher compared to 2022. We are not provided with specific earnings figures.
Marmon, a conglomerate of over 100 companies, posted revenues of $11.9 billion in 2023, an increase of 11.6% compared to 2022. Pre-tax earnings increased by 13.1% in 2023. Three former non-insurance businesses of Alleghany, which was acquired in 2022, were responsible for most of the revenue increase. Beginning in 2024, Marmon’s results will include Scott Fetzer, a company acquired by Berkshire in 1985.3
IMC posted revenues of $4 billion in 2023, an increase of 8% compared to 2022. Pre-tax earnings increased 6.9%, reflecting some margin compression due to higher material costs, changes in sales mix, and the impact of geopolitical conflicts. IMC is based in northern Israel. Up to this point, operations have not been significantly impacted by the Hamas terrorist attacks of October 7, 2023.4
Manufacturing — Building Products
The following exhibit shows revenues, pre-tax earnings, and operating margin for the building products segment since 2018 on a TTM basis.
The most important businesses in the group are Clayton Homes, Shaw, Johns Manville, Acme Brands, Benjamin Moore, and MiTek.
Clayton Homes posted revenues of $11.4 billion in 2023, a decline of $1.3 billion compared to 2022, driven by a decline of $1.6 billion in home sales. New home unit sales declined 13.7% in 2023. Partly offsetting this decline, financial services revenue increased 12.2% due to increased interest income on a portfolio of loans valued at approximately $23.8 billion at yearend, an increase of $2.5 billion over the past year.
Aggregate revenues for building products, excluding Clayton Homes, came in at $14.5 billion in 2023, a decrease of 10% from 2022 levels due to “overall lower sales volumes and changes in product mix, partly offset by higher selling prices.” Pre-tax earnings for building products, excluding Clayton Homes, were $2.1 billion in 2023, a decrease of 11.4% compared to 2022 “driven by lower sales volumes, reduced manufacturing efficiencies and higher losses from restructurings, plant closures and divestitures in 2023, partially offset by lower raw materials costs and energy costs as well as reduced freight, shipping and utilities expenses.”
The building products group fared surprisingly well through the pandemic. A strong real estate market coupled with demand for home renovations played a role in the performance of the group. Higher interest rates over the past year dampened results, as Clayton’s lower unit sales volume demonstrates. The overall margin profile of the group has significantly improved over the past five years.
Manufacturing — Consumer Products
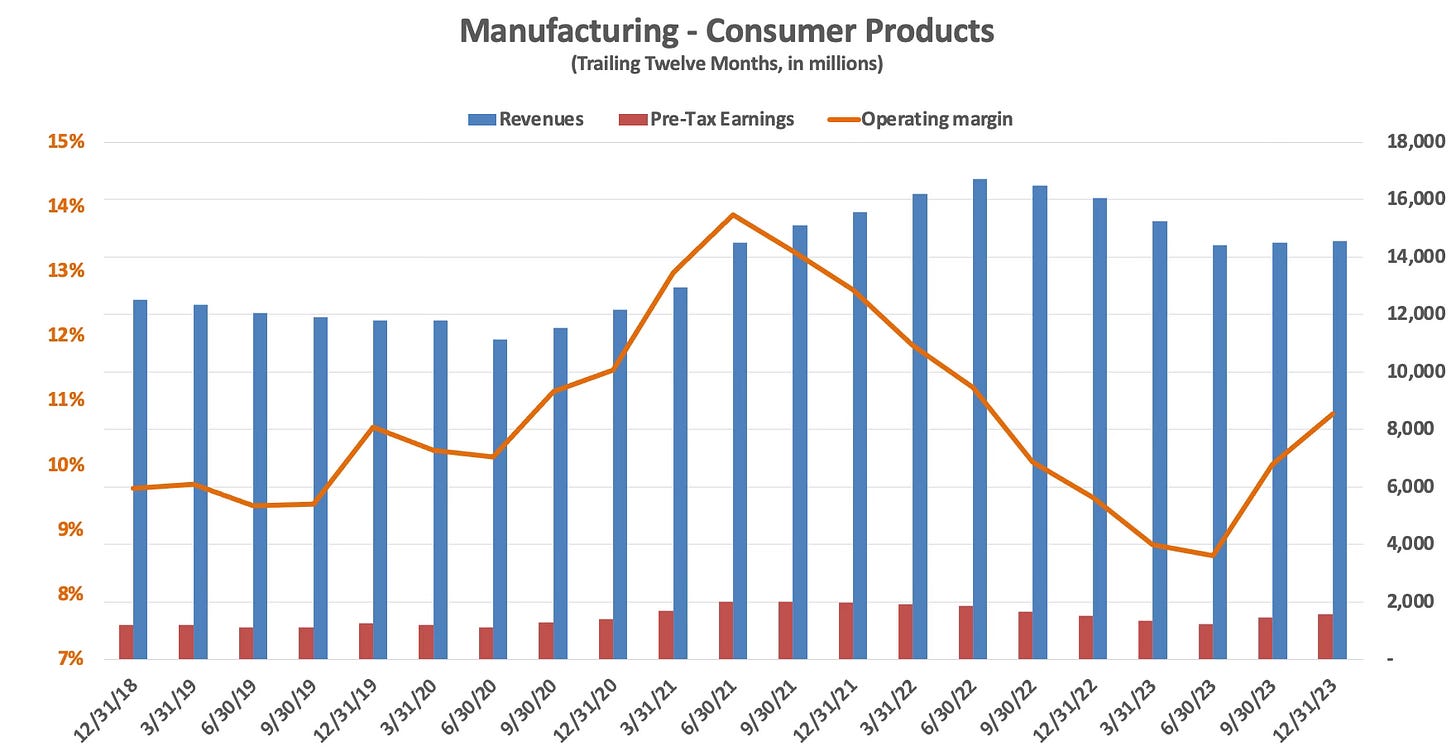
The following exhibit shows revenues, pre-tax earnings, and operating margin for the consumer products segment since 2018 on a TTM basis.
The notable businesses within this group include Forest River, Fruit of the Loom, Garan, Fechheimer, H.H. Brown Shoe Group, Brooks Sports, Duracell, Larson-Juhl, Richline, and Jazwares. Granularity of reporting is quite limited in this group.
Forest River is a manufacturer of recreational vehicles and experienced booming business starting in the second half of 2020 as consumers flocked to buy RVs at a time when other forms of travel were extremely limited. However, starting in the second half of 2022 and through most of 2023, RV sales declined significantly due to rising interest rates and other macroeconomic headwinds. This resulted in a 26.3% revenue decline in 2023 compared to 2022 and an unspecified decline in earnings.5
Apparel and footwear revenues declined by $452 million, or 9.4%, in 2023 compared to 2022 primarily due to reduced unit volumes partly offset by higher selling prices. Few details are provided on this group in the annual report but we are told that “certain of our apparel and footwear businesses took action in 2023 to reduce inventories and right-size operations.”
As we can see from the chart, consumer products has volatile margins and is exposed to business downturns caused by higher interest rates and a reduction of consumer spending. Margins peaked on a TTM basis in the second quarter of 2021 and declined precipitously for two years but signs of a reversal have been apparent more recently. TTM revenues for the group have only increased by 16.2% over the past five years, below the rate of reported inflation in the CPI, and margins have not expanded enough to offset this impact on earnings. The group has shrunk in real terms.
Service
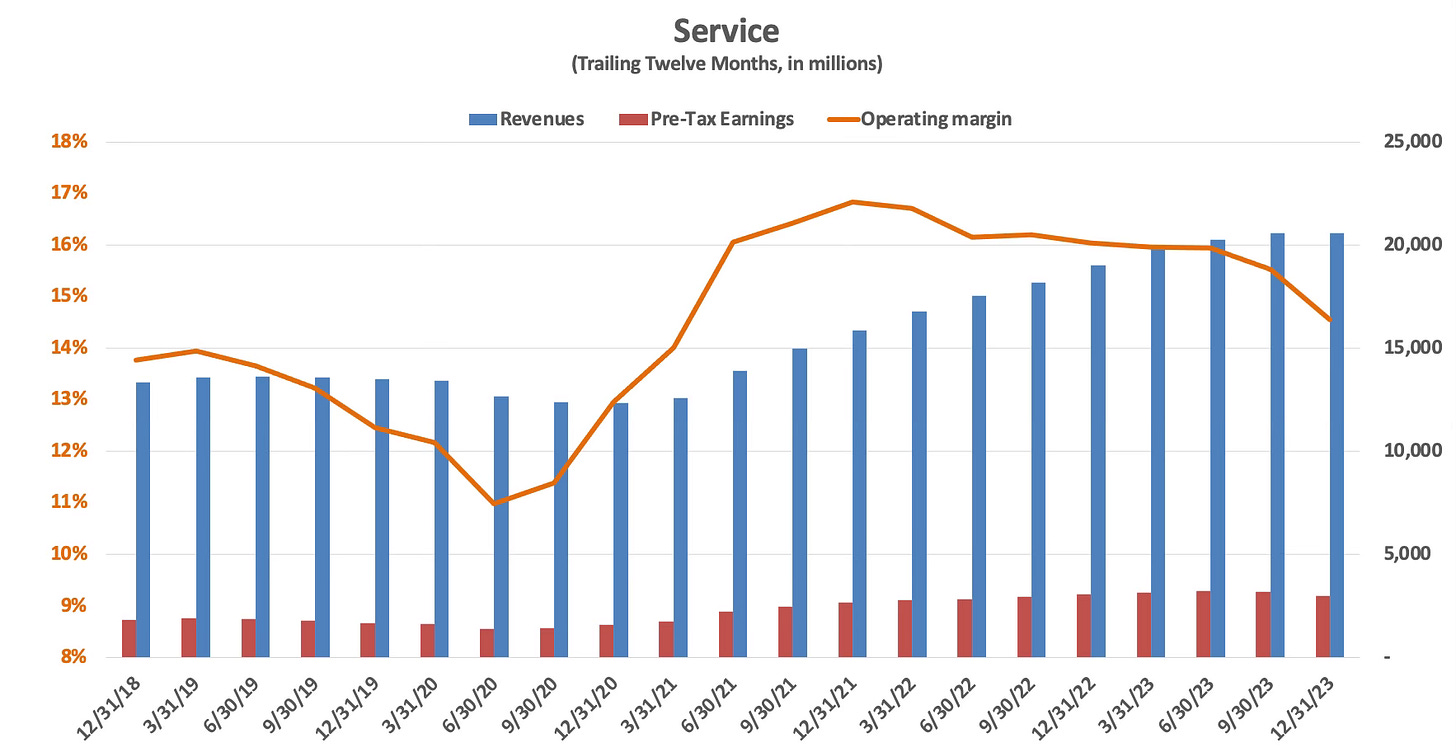
The following exhibit shows revenues, pre-tax earnings, and operating margin for the service segment since 2018 on a TTM basis.
The service group consists of NetJets, FlightSafety, TTI, Dairy Queen, Leasing services (XTRA and CORT), Charter Brokerage, Business Wire, the WPLG television station, and IPS, a business that was part of the Alleghany acquisition. Unfortunately, reporting granularity is very limited for this group.
Flight Services, comprised of NetJets and FlightSafety posted a revenue increase of 11.5% in 2023 compared to 2022 due to an increase in the number of aircraft in the NetJets shared ownership program as well as an increase in flight hours and higher rates. FlightSafety’s business involves providing advanced flight simulators and other training to pilots. Earnings for flight services increased by an unspecified amount.
TTI, a distributor of electronic equipment, posted a revenue decline of 2.7% in 2023 compared to 2022 due to a decline in new orders in several regions, most notably in the Asia-Pacific region. Customer inventory levels were elevated and there was more price competition, conditions that are expected to persist in 2024.
IPS, added due to the Alleghany acquisition in October 2022, contributed $1.3 billion of revenues in 2023 compared to $358 million of revenues in 2022.
Excluding the effect of IPS, revenue for the service group advanced modestly in 2023 and pre-tax earnings were down 1.7% due to margin contraction. Margins could recover in 2024 due to strong performance in Flight Services, although management’s commentary about TTI implies continued margin pressure in that business.
Retailing
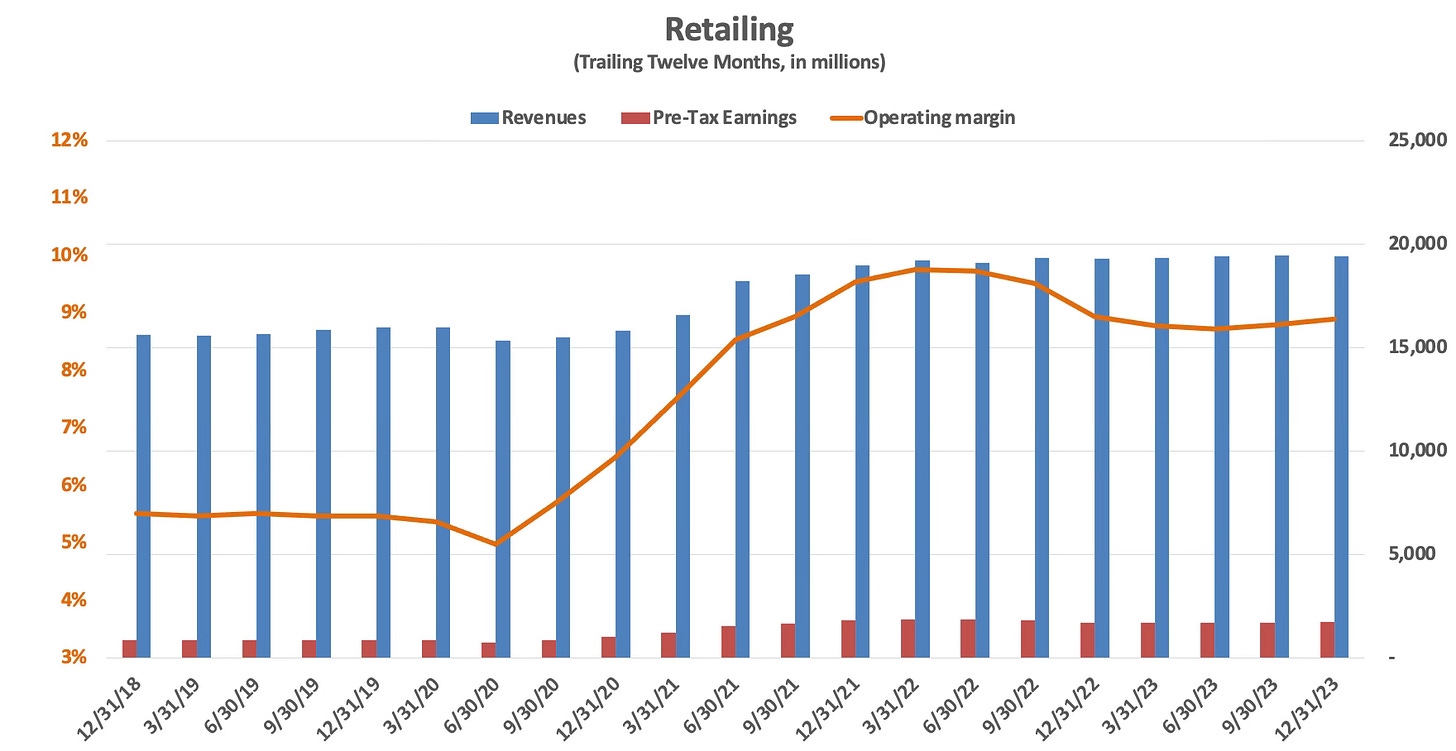
The following exhibit shows revenues, pre-tax earnings, and operating margin for the retailing segment since 2018 on a TTM basis.
This group includes Berkshire Hathaway Automotive (67% of revenues), four furniture retailing businesses (18% of revenues), three jewelry retailers, See’s Candies, Pampered Chef, Oriental Trading Company, and Detlev Louis Motorrad.
Berkshire Hathaway Automotive revenues increased 3.9% in 2023 compared to 2022. New vehicle revenues were up 12.6% while pre-owned vehicle revenues were down 9.4%. New vehicle unit sales were up 11.7% while pre-owned vehicle unit sales were down 4.7%. Revenues from parts, service, and repair operations increased 6.6%. Pre-tax earnings increased 17.7% in 2023. Vehicle gross profit margin peaked in mid-2022 due to supply chain disruptions and have declined since then. New vehicle inventory levels remain historically low but have been gradually rising recently.
Other retailing revenues, in aggregate, declined 5.6% in 2023 compared to 2022. Home furnishing revenues were down 8.6%. Aggregate pre-tax earnings declined 21.8% in 2023 primarily due to a 28.3% decline in earnings from home furnishings.
The retailing group is dominated by Berkshire Hathaway Automotive. We are no longer provided with specific information on many of Berkshire’s well known businesses, such as See’s Candies, because they are not material to the overall results of the group. As a result, it is not easy to determine the drivers for this segment, other than what management chooses to tell us. Home furnishings seems to be a very weak spot at the moment.
Margins have improved in this group and pre-tax profits have advanced significantly as a result. In 2019, the group posted revenues of $16 billion and earnings of $874 million. In 2023, revenues advanced to $19.4 billion and earnings jumped to $1.7 billion due to margin expansion, despite pressure in weak areas like home furnishings.
McLane
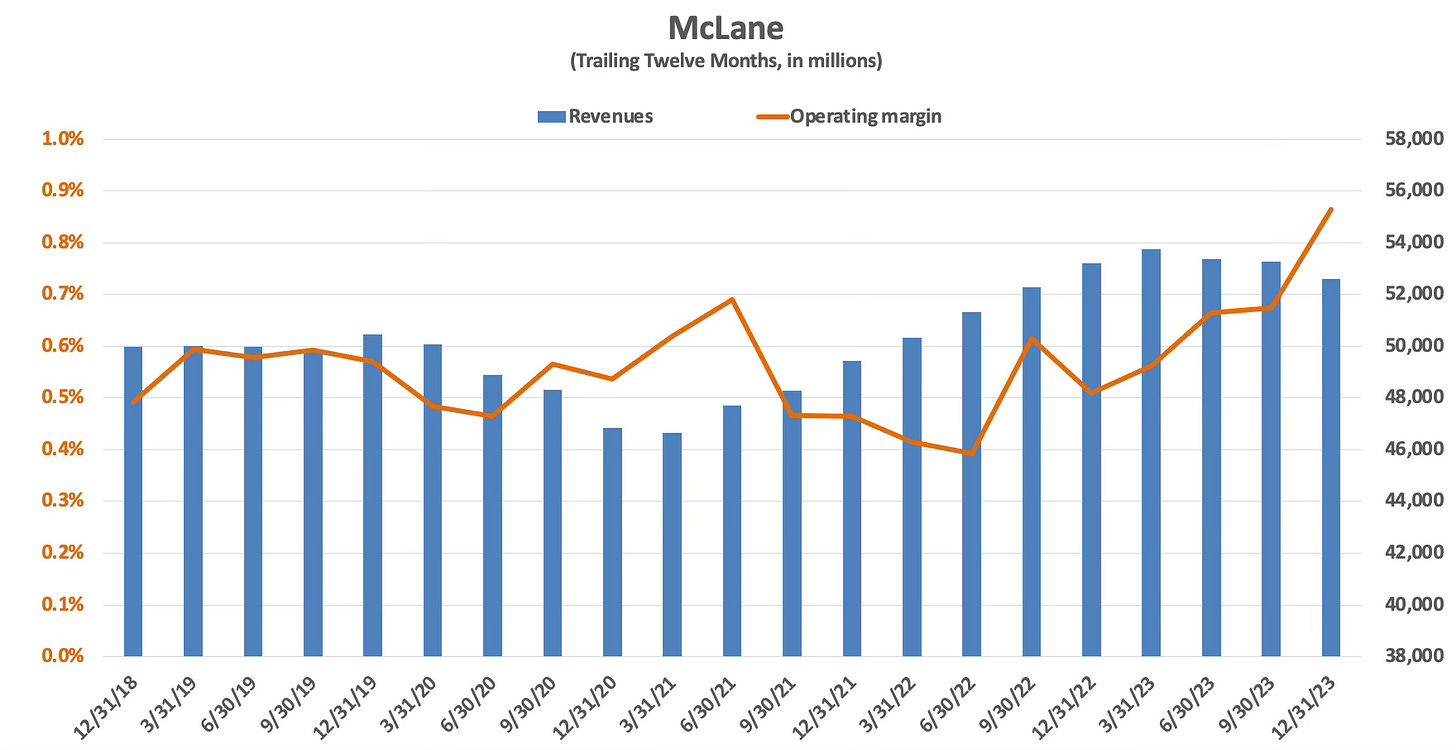
McLane is a wholesale distributor of groceries and non-food consumer products to retailers and convenience stores and has operations in wholesale distribution of alcohol. The business is characterized by high revenues and extremely low profit margins. As a result, the chart format I’ve used for the other segments is not very useful since pre-tax earnings would be barely visible relative to revenues. The chart below shows McLane’s revenues on a TTM basis and the operating margin.
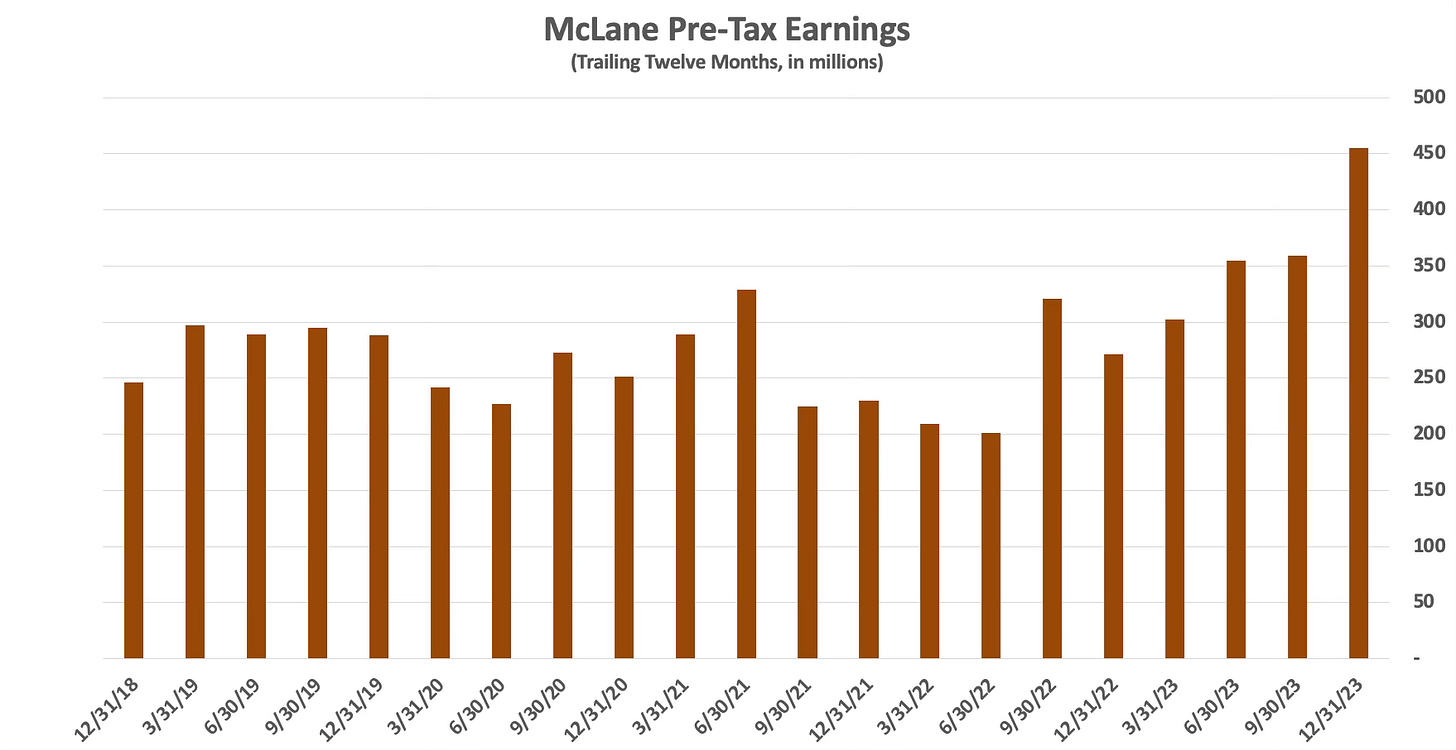
The exhibit below shows McLane’s pre-tax earnings on a TTM basis:
McLane posted revenues of $52.6 billion in 2023, a decline of 1.2% compared to 2022. Pre-tax earnings rose by $184 million to $455 million, an increase of 67.9%.
We are provided with scant details regarding the business: “Revenues from the grocery and foodservice businesses declined 0.8% and 2.2%, respectively, while revenues from the beverage business increased 1.9% compared to 2022. Revenues of the grocery and the foodservice businesses were negatively affected in 2023 by lower unit volumes.” The jump in earnings is attributed to “a slight increase in the overall gross sales margin rate, increased other income and lower fuel expenses, partly offset by higher personnel expenses.”
McLane’s revenues have grown by 5.2% over the past five years, from $49,987 million in 2018 to $52,607 million in 2023. Earnings have advanced from $246 million in 2018 to $455 million in 2023 due to the operating margin increasing from 0.5% to 0.9%. However, it is important to note that this margin boost is not likely to be repeated. If McLane’s revenues continue to stagnate, actually declining significantly in real terms, profitability for the business will fail to increase in real terms in the long run.
Conclusion
“I make many mistakes. Consequently, our extensive collection of businesses includes some enterprises that have truly extraordinary economics, many others that enjoy good economic characteristics, and a few that are marginal.”
— Warren Buffett, 2021 letter to shareholders
Few CEOs are willing to be candid about their mistakes. Warren Buffett has certainly made mistakes, with the Precision Castparts purchase serving as a good example, as he explained in some detail in his 2020 letter to shareholders.
Berkshire’s collection of non-insurance businesses is enormous and it is not an easy task to keep up with all of them. There are several conglomerates within Berkshire which is itself a conglomerate. For example, Marmon is a collection of over a hundred businesses. Berkshire provides its managers with an unusual amount of autonomy. Until 2018, all of the mangers of major groups reported directly to Warren Buffett. This was untenable in the long run and Mr. Buffett wisely chose to delegate oversight of the group to Greg Abel starting in 2018. I am not sure what structure Mr. Abel has put in place, but the 30,000 foot view of margins for the entire group is promising.
There are businesses in MSR that I am not excited about and there will always be problem areas. While it is frustrating to not have granular detail on each of these operations, Berkshire’s annual report would run hundreds of pages longer to provide such detail and information useful to competitors would be needlessly revealed.
I started this long article noting that the MSR group represented “ballast” in troubled times. Ballast provides essential stability for a ship, but the other implication of the analogy is that excessive ballast can weigh a ship down unnecessarily.
Berkshire has a policy of holding the companies it acquires “forever” aside from rare situations. This policy has served the company well over many decades, and I doubt Greg Abel will start to jettison underperforming businesses. It is more likely that under performers will slowly fade into irrelevancy over long periods of time.
In the event of a very large underwriting loss in Berkshire’s reinsurance group, which could conceivably run up to $15 billion pre-tax, it is reassuring to know that earnings from the MSR group would almost certainly cover the loss. Of course, there would be no shortage of cash anyway due to Berkshire’s perennially large stockpile of cash and treasury bills. Berkshire’s insurance group benefits greatly from the stability offered by the MSR group, BNSF, BHE, and the company’s large cash balance.
Hopefully this article has been helpful for getting a sense of the MSR group as a whole as well as the reportable segments within it.
If you found this article interesting, please click on the ❤️️ button and consider sharing it with your friends and colleagues.
Thanks for reading!
Copyright, Disclosures, and Privacy Information
Nothing in this article constitutes investment advice and all content is subject to the copyright and disclaimer policy of The Rational Walk LLC.
Your privacy is taken very seriously. No email addresses or any other subscriber information is ever sold or provided to third parties. If you choose to unsubscribe at any time, you will no longer receive any further communications of any kind.
The Rational Walk is a participant in the Amazon Services LLC Associates Program, an affiliate advertising program designed to provide a means for sites to earn advertising fees by advertising and linking to Amazon.com.
Individuals associated with The Rational Walk own shares of Berkshire Hathaway.
According to the BLS CPI Calculator, $1,000 in December 2018 had the same purchasing power as $1,220.96 in December 2023, corresponding to inflation of 22.1%.
In fiscal 2015, the final full year prior to the acquisition, Precision Castparts reported net sales of $10 billion, pre-tax earnings of $2.5 billion, and net earnings of $1.5 billion. Berkshire’s acquisition, at $32 billion, implies a multiple of over 21x net income, perhaps a reasonable price to pay for a growing business. However, Precision Castparts has performed poorly, resulting in the 2020 impairment. In his 2020 letter to shareholders, Warren Buffett acknowledged that he paid too much for the business: “No one misled me in any way – I was simply too optimistic about PCC’s normalized profit potential. Last year, my miscalculation was laid bare by adverse developments throughout the aerospace industry, PCC’s most important source of customers.”
Scott Fetzer is itself a conglomerate made up of multiple brands ranging from air compressors to the World Book Encyclopedia. In the late 1990s, Scott Fetzer was still broken down as a reported segment in Berkshire’s financial statements. In 1999, it accounted for $1,021 million of revenues and $147 million of operating profits.
IMC is based in Tefen, Israel, just a few miles south of the Lebanon border. I am not surprised that IMC has yet to be significantly impacted by direct impacts of the war in the Gaza Strip, which is in southern Israel. However, I would be concerned about the impact of an opening of a northern front in the war against Hezbollah which is based in Lebanon. IMC is a global business. My understanding is that domestic demand within Israel is a small percentage of the company’s overall customer base.
The Q3 2023 report indicated that Forest River’s revenues declined by 31.5% in the first nine months of 2023 with pre-tax earnings declining by 34.5% compared to the first nine months of 2022.


