Berkshire Hathaway's Q3 2023 Results — Manufacturing, Service, and Retailing
A review of Berkshire's large collection of non-insurance operating businesses
“Over the years, I have made many mistakes. Consequently, our extensive collection of businesses currently consists of a few enterprises that have truly extraordinary economics, many that enjoy very good economic characteristics, and a large group that are marginal. Along the way, other businesses in which I have invested have died, their products unwanted by the public. Capitalism has two sides: The system creates an ever-growing pile of losers while concurrently delivering a gusher of improved goods and services. Schumpeter called this phenomenon ‘creative destruction.’”
— Warren Buffett, 2022 letter to shareholders
When you see a person every day, or even once every few months, chances are that you will not notice the subtle impacts of the passage of time. But if you have not seen a friend or relative for five or ten years, you’re likely to be surprised. The accumulation of small changes over a long period of time can make a person almost unrecognizable.
This effect is also apparent when looking at a company like Berkshire Hathaway. It is not that individual business units within Berkshire change that much over time. Warren Buffett tends to stick to businesses that are fairly mature and stable and he hardly ever sells a business. The effect is produced by acquisitions that accumulate over time and make the overall conglomerate almost unrecognizable. For example, take a look at the following summary of Berkshire’s non-insurance operations in 1999:
This is the data I had in early 2000 as I built my initial position in the company. With the exception of Buffalo News, which was sold in 2020, Berkshire still operates the businesses in each of the segments listed in the 1999 annual report. However, all of these segments have been subsumed into larger groupings due to acquisitions made over nearly a quarter century. As much as I would like to have access to the financial data for See’s Candies today, it is just a small part of Berkshire’s current retailing segment. The same is true for the other segments of 1999.
Fast forward to the 2022 annual report. Here is the breakdown given for Berkshire’s manufacturing, service, and retailing group:
Within the two groups, results are further broken down into slightly more granular categories, but we are still faced with a very high-level view of Berkshire’s non-insurance operations. On the positive side, the size of Berkshire’s operations makes it unnecessary to expose granular information on individual businesses that could be helpful to competitors. On the negative side, shareholders see a cloudier view. However, with some work, we can still monitor trends in the information that Berkshire does provide to see how these businesses are doing, at least in aggregate.
At a very high level, we can look at quarterly net earnings for the group since 2018. This is useful since we can spot the slowdown during the steep pandemic-era decline in 2020 as well as the sharp recovery between mid-2020 and mid-2021. Since then, quarterly earnings growth has been relatively muted.
This article presents a summary of Berkshire’s manufacturing, service, and retailing group based on how I follow these business units on a quarterly basis. After going through the data and presentation provided in Berkshire’s filings, I will provide a longer term view of the group.
Third Quarter and Year-to-Date Results
Let’s start with an overview from Berkshire’s Q3 report showing revenue and earnings for the group for the third quarter and first nine months of the year:
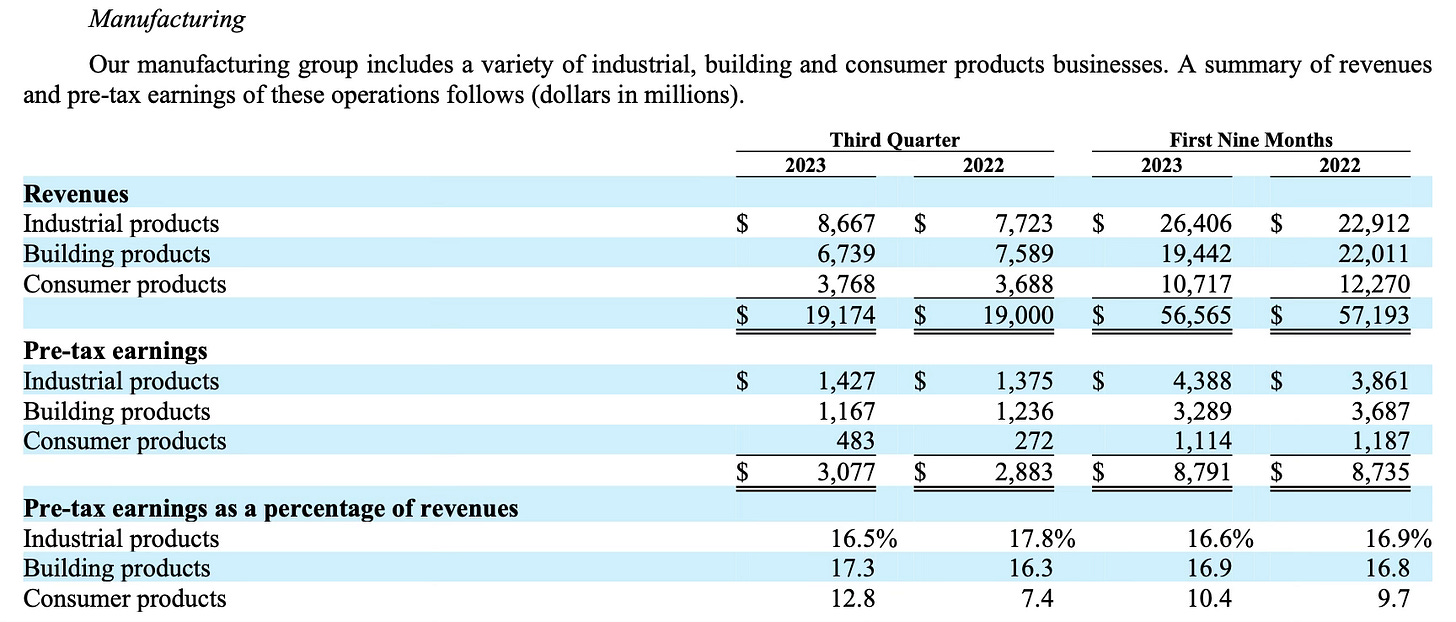
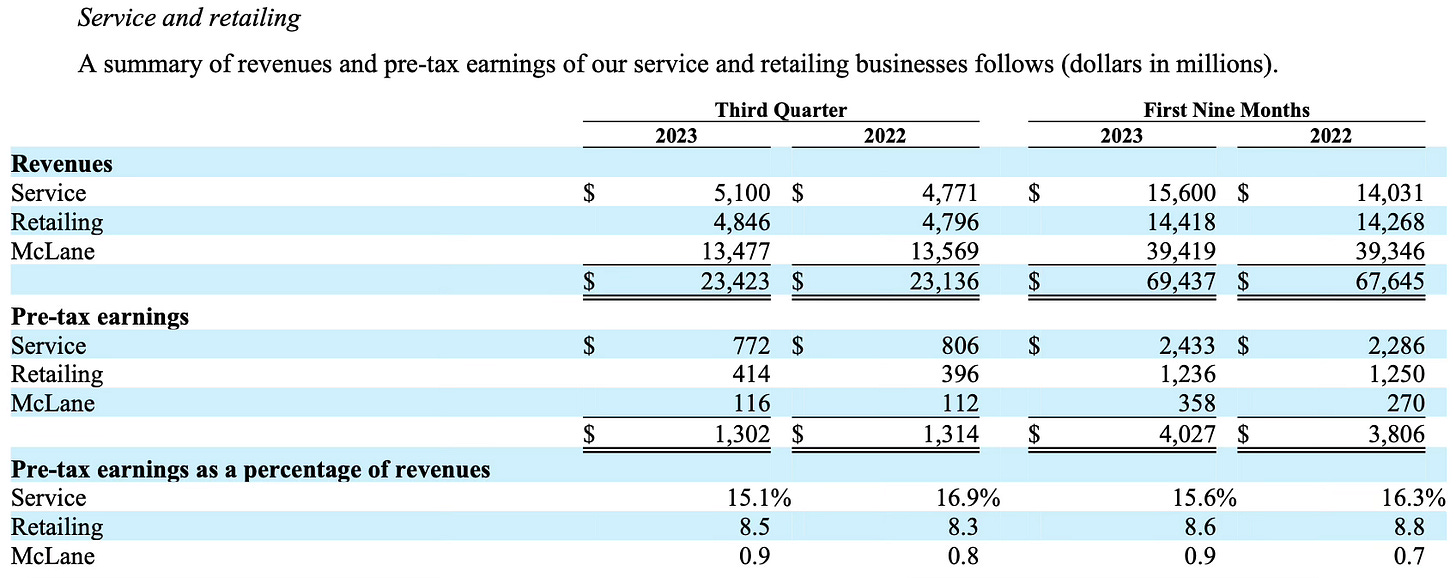
While the manufacturing group posted only modestly higher revenue for the third quarter and a small decline for the first nine months of 2023, pre-tax earnings were up 6.7% for the quarter and 0.6% for the first nine months due to higher margins. Revenue for service and retailing was up 1.2% for the third quarter and 2.6% for the first nine months of 2023. Pre-tax earnings were down 0.9% for the third quarter and up 5.8% for the first nine months of 2023.
Manufacturing
Berkshire breaks down the manufacturing group into three segments: Industrial, Building, and Consumer products. By examining each of these sub-groups, we can see where margins have expanded and compressed:
Industrial Products. The most important businesses in the group are Precision Castparts, Lubrizol, Marmon, and IMC. These businesses accounted for ~91% of industrial products revenue in the third quarter and first nine months 2023.
Precision Castparts posted revenues of $2.3 billion in the third quarter and $6.9 billion for the first nine months of 2023 representing increases of 21.4% in the third quarter and 26% in the first nine months of 2023 compared to 2022. Pre-tax earnings increased 43.1% in the third quarter and 32.5% in the first nine months of 2023 compared to 2022, reflecting higher margins. Business is booming for aerospace products and management is optimistic that long-term trends will remain favorable. Berkshire acquired Precision Castparts in 2015 and took significant goodwill write downs in 2020 when the business was pummeled by the pandemic.
Lubrizol posted revenues of $1.6 billion in the third quarter and $4.9 billion for the first nine months of 2023 representing decreases of 10% in the third quarter and 3.6% in the first nine months of 2023 compared to 2022. This was driven by lower volume of approximately 10% due to general market weakness. Pre-tax earnings declined by 41.2% in the third quarter and 19.8% in the first nine months of 2023 compared to 2022. However, excluding insurance recoveries related to fires that were collected in 2022, earnings were higher for the third quarter and first nine months of the year.
Marmon, a conglomerate of over 100 companies, posted revenues of $3 billion in the third quarter and $9.2 billion for the first nine months of 2023, representing increases of 10.4% in the third quarter and 13% in the first nine months of 2023 compared to 2022. Pre-tax earnings were “essentially unchanged” in the third quarter and increased 13.9% in the first nine months of 2023 compared to 2022. Marmon’s revenues were bolstered by acquisitions, including the incorporation of three businesses that were part of Alleghany, a company that Berkshire acquired in 2022.
IMC, also known as Iscar, posted revenues of $1 billion in the third quarter and $3 billion in the first nine months of 2023 representing increases of 8.2% in the third quarter and 7.9% for the first nine months compared to 2022. Pre-tax earnings were flat in the third quarter and increased 6.4% in the first nine months of 2023 compared to 2022. As of the date of the 10-Q filing, the company’s operations, headquartered in northern Israel, “have not been significantly impacted” by the war in the Gaza Strip region in the south.
Building Products. The most important businesses in the group are Clayton Homes, Shaw, Johns Manville, Acme Brands, Benjamin Moore, and MiTek.
Clayton Homes posted revenues of $3 billion in the third quarter and $8.4 billion for the first nine months of 2023. This represents declines of 8.8% for the third quarter and 12% for the first nine months of 2023 compared to 2022. Pre-tax earnings declined 14% in the third quarter and 13.7% for the first nine months of 2023 compared to 2022. Revenues from home sales declined by $1.3 billion (17.1%) in the first nine months of 2023 primarily due to new home unit sales declining by 17.5% reflecting declines in both factory-built and site-built homes. Financial service revenue (mortgage origination services and interest income) increased 11.3% in the first nine months of 2023 due to higher interest income on higher loan balances. Clayton had loan balances of ~$23.1 billion at the end of the quarter, an increase of 13.2% over the past year.
Other businesses in the group posted revenues of $3.8 billion in the third quarter and $11.1 billion for the first nine months of 2023 compared to 2022. Aggregate pre-tax earnings increased 3.2% in the third quarter and declined 8.2% in the first nine months of 2023 compared to 2022. Berkshire does not provide specific granularity for Shaw, Johns Manville, and the other major businesses within this group, most likely due to competitive factors.
Consumer Products. The notable businesses within this group include Forest River, Fruit of the Loom, Garan, Fechheimer, H.H. Brown Shoe Group, Brooks Sports, Duracell, Larson-Juhl, Richline, and Jazwares. Granularity is quite limited in this group, perhaps due to the need to guard data useful to competitors.
Forest River revenues declined 17.1% in the third quarter and 31.5% in the first nine months of 2023 compared to 2022. Pre-tax earnings declined by 34.8% in the first nine months of 2023 compared to 2022. The company manufactures recreational vehicles. Business was strong through the first half of 2022 but has declined significantly since then due to rising interest rates, inflation, and other macroeconomic factors.
Apparel and footwear revenues declined $148 million, or 11.2% in the third quarter and $370 million, or 9.9% in the first nine months of 2023 compared to 2022. This was primarily due to a decline of 15.1% in the apparel business during the first nine months of 2023 due to lower volume, offset by higher selling prices. Pre-tax earnings increased 27.3% in the first nine months of 2023 compared to 2022, a year that was negatively impacted by low sales volume and rising raw materials, freight, labor, and other operating costs.
Jazwares joined Berkshire as part of the Alleghany acquisition in 2022 and contributed $847 million of revenues in the first nine months of 2023. Earnings information is not provided, but the language in the discussion indicates that pre-tax earnings of the group increased due to Jazwares.
Service and Retailing
Berkshire breaks down the service and retailing group into three segments: Service, Retailing, and McLane.
Service. This group consists of NetJets, FlightSafety, TTI, Dairy Queen, Leasing services (XTRA and CORT), Charter Brokerage, Business Wire, the WPLG television station, and IPS, a business that was part of the Alleghany acquisition. Reporting granularity is very limited for this group.
Flight Services, comprised of NetJets and FlightSafety, posted revenue increases of 8.3% in the third quarter and 11.5% in the first nine months of 2023. There were increases in the number of aircraft in NetJets shared ownership programs, an increase in flight hours, and higher average rates.
TTI revenues declined by 7.2% in the third quarter and 0.8% in the first nine months of 2023. After experiencing significant revenue growth in 2021 and the first half of 2022, new orders slowed in several regions, particularly in the Asia-Pacific region, and management expects these conditions to persist into 2024. Year-to-date earnings from TTI declined by 10.3%.
IPS, added due to the Allegheny acquisition, contributed revenues of $343 million in the third quarter and $947 million for the first nine months of 2023.
Retailing. This group includes Berkshire Hathaway Automotive (68% of revenues), four furniture retailing businesses (18% of revenues), three jewelry retailers, See’s Candies, Pampered Chef, Oriental Trading Company, and Detlev Louis Motorrad.
Berkshire Hathaway Automotive revenues increased 3.9% in the third quarter and 4.3% in the first nine months of 2023 compared to 2022. New vehicle revenues were up 13.7% while pre-owned vehicle revenues were down 9.3% in the first nine months of 2023. New vehicle unit sales were up 11.5% while pre-owned vehicle unit sales were down 4.6% in the first nine months of 2023. Revenues from parts, service, and repair operations increased 8.2%. Pre-tax earnings increased 14.2% in the third quarter and 18.6% in the first nine months of 2023 compared to 2022.
Other retailing revenues, in aggregate, declined 5.2% in the first nine months of 2023. Home furnishing revenues were down 8.7% on lower consumer traffic. Aggregate pre-tax earnings declined 26.9% in the first nine months of 2023 primarily due to a 31.1% decline in earnings from home furnishings.
McLane operates a large wholesale distribution business providing food and non-food products to retailers, convenience stores, and restaurants. The business is characterized by very low margins. Revenues declined by 0.7% in the third quarter and increased 0.2% in the first nine months of 2023 compared to 2022. Revenues were negatively impacted by lower unit volumes. Pre-tax earnings increased 3.6% in the third quarter and 32.6% in the first nine months of 2023 compared to 2022, reflecting a slight increase in gross margin and lower fuel expenses, partially offset by higher personnel expenses.
In an inflationary environment, we should recognize that flat revenues in nominal terms reflects a decline in real terms, as noted in management’s reference to lower unit volumes. Although pre-tax earnings improved, a lower level of physical volume is a concern but details are not provided regarding the underlying cause of the decline.
The preceding discussion is an abbreviated summary of the information contained in the management’s discussion and analysis (MD&A) section of the third quarter report. Readers seeking full details should review the actual MD&A, but hopefully this summary has been helpful for those looking for a more general overview.
A Longer Term View
Let’s turn our attention to a longer term view of the results of the manufacturing, service, and retailing group. I find it helpful to do this in two ways. I start by looking at the figures on a sequential basis. This useful, but in some ways limiting due to seasonal effects in several of Berkshire’s businesses. By aggregating the last four quarters of data, I can look at each reporting segment on a “trailing twelve month” basis which smooths out seasonal fluctuations.
I have collected data for group on a quarterly basis going back to Q1 2018, when the current reporting structure was put in place, but to keep the presentation to a reasonable size, the screen shots I am posting below only go back eight quarters. I have provided a spreadsheet with data going back to 2018 at the end of this section for those who would like to see the source material.
Let’s take a look at the quarterly data first:
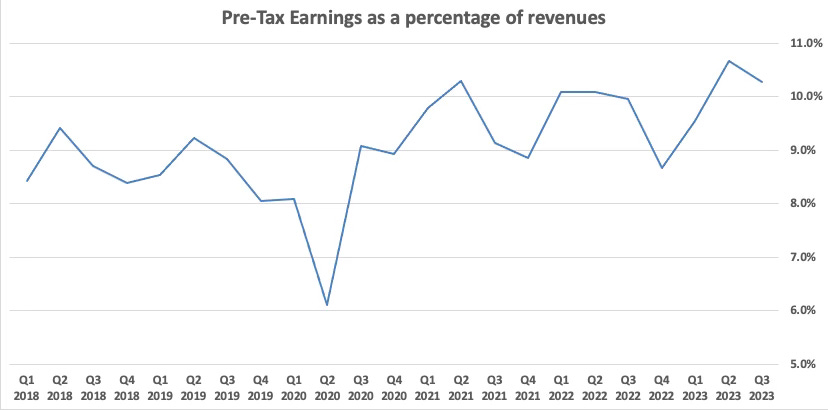
I find it useful to look at pre-tax earnings as a percentage of revenues to track progress on a sequential basis. We can see this margin data at an aggregate level for the entire group as well as for each sub-group. Margins have improved significantly in recent years. The following exhibit shows pre-tax margin since Q1 2018. We can clearly see the impact of the pandemic in Q2 2020.
Let’s turn our attention to results on a trailing twelve month basis. To arrive at these figures, I aggregate the data for the last four quarters. For example, the figures in the 9/30/23 column are the sum of Q4 2022, Q1 2023, Q2 2023, and Q3 2023:
As expected, the figures are less volatile when viewed on a trailing twelve month basis, allowing us to spot trends without the effect of seasonal variations that exist in a quarterly sequential presentation. Taking a long view, trailing margins for the overall group have been on an upward trajectory. For the twelve months ending on September 30, 2019, pre-tax margin was 8.8% compared to 9.8% for the twelve months ending on September 30, 2023.
This is a meaningful improvement over four years. Credit is due to Greg Abel, Vice Chairman for non-insurance operations, who assumed his position in January 2018. Mr. Abel has since been designated as Warren Buffett’s eventual successor as CEO. Since 2018, the CEOs of Berkshire’s non-insurance businesses have reported to Mr. Abel rather than Mr. Buffett.
A spreadsheet containing the source data can be downloaded using the link below:
Conclusion
If we look back a quarter century, each of Berkshire’s non-insurance segments were easily identifiable businesses and shareholders could monitor results of discrete businesses like See’s Candies or Dairy Queen. But over time, the collection of businesses grew to the point where they had to be grouped into larger reporting segments and it became difficult to monitor the results of individual businesses.
This change has been gradual and year-to-year reporting changes were not dramatic, but the effect over a long period of time has been profound. We can still monitor results at a somewhat granular level for the largest of the non-insurance businesses, but small subsidiaries like See’s Candies are now lost in the results of larger groups.
One of the disadvantages of conglomerates is that results become obscured and if management wants to hide poor performers, they can certainly find ways to do so. In Berkshire’s case, I believe that reorganizations of the reporting structure are done for legitimate reasons. If Berkshire continued to report granular results for subsidiaries like See’s, the company’s reports would stretch to hundreds of pages. The majority of shareholders would be unwilling to delve into the details but competitors certainly would scrutinize the reports very carefully.
Shareholders are left with the task of reviewing this group at the 30,000 foot level. Monitoring overall margins over reasonably long periods of time is a good way to follow the group. Of course, looking at earnings without considering the capital required to produce those earnings is an incomplete analysis. Unfortunately, Berkshire has not provided balance sheet data for the group since 2016. This data used to be provided in Warren Buffett’s shareholder letters.
Hopefully this article has been a useful overview of the manufacturing, service, and retailing group. This concludes my series of articles following Berkshire Hathaway’s third quarter report. Previous articles in the series appear below:
This article is exclusively for paid subscribers. If you found this article interesting, please click on the ❤️️ button and consider referring a friend to The Rational Walk.
Thanks for reading!
Copyright, Disclosures, and Privacy Information
Nothing in this article constitutes investment advice and all content is subject to the copyright and disclaimer policy of The Rational Walk LLC.
Your privacy is taken very seriously. No email addresses or any other subscriber information is ever sold or provided to third parties. If you choose to unsubscribe at any time, you will no longer receive any further communications of any kind.
The Rational Walk is a participant in the Amazon Services LLC Associates Program, an affiliate advertising program designed to provide a means for sites to earn advertising fees by advertising and linking to Amazon.com.
Long Berkshire Hathaway.


